
Page 228 - ITU Kaleidoscope 2016
P. 228
2016 ITU Kaleidoscope Academic Conference
quirements that each of the techniques requires to perform formation is used to predict which frequencies are available
well have not been discussed in the literature clearly. The at different locations using the primary transmitter’s details
presence or absence of these requirements in a region could and radio propagation models. These models can be statisti-
potentially affect their performance. Therefore, this paper cal, based only on distance and frequency, or they can based
considers a broader analysis of each approach by looking at on ray tracing techniques that require detailed information
factors that can affect their performance and also by looking about the terrain elevation in the area of interest. Therefore,
at the impact of these factors in a developed region and/or correct identification of the presence of a TV signal at a given
developing region. location depends on the fidelity of the database information
The paper is structured as follows; Section 2 gives a gen- and quality of the propagation model used to predict signal
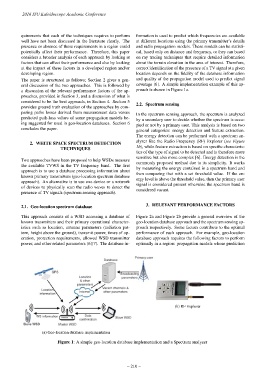
eral discussion of the two approaches. This is followed by coverage [6]. A simple implementation example of this ap-
a discussion of the relevant performance factors of the ap- proach is shown in Figure 1a.
proaches, provided in Section 3, and a discussion of what is
considered to be the best approach, in Section 4. Section 5
2.2. Spectrum sensing
provides ground truth evaluation of the approaches by com-
paring paths losses derived from measurement data versus
In the spectrum sensing approach, the spectrum is analyzed
predicted path-loss values of some propagation models be-
by a secondary user to decide whether the spectrum is occu-
ing suggested for used in geo-location databases. Section 6
pied or not by a primary user. This analysis is based on two
concludes the paper.
general categories: energy detection and feature extraction.
The energy detection can be performed with a spectrum an-
alyzer like the Radio Frequency (RF) Explorer (see Figure
2. WHITE SPACE SPECTRUM DETECTION
1b), while feature extraction is based on specific characteris-
TECHNIQUES
tics of the type of signal to be detected and is therefore more
sensitive but also more complex [6]. Energy detection is the
Two approaches have been proposed to help WSDs measure
commonly proposed method due to its simplicity. It works
the available TVWS in the TV frequency band. The first
by measuring the energy contained in a spectrum band and
approach is to use a database processing information about
then comparing that with a set threshold value. If the en-
known primary transmitters (geo-location spectrum database
ergy level is above the threshold value, then the primary user
approach). An alternative is to use one device or a network
signal is considered present otherwise the spectrum band is
of devices to physically scan the radio waves to detect the
considered vacant.
presence of TV signals (spectrum sensing approach).
3. RELEVANT PERFORMANCE FACTORS
2.1. Geo-location spectrum database
This approach consists of a WSD accessing a database of Figure 2a and Figure 2b provide a general overview of the
known transmitters and their primary operational character- geo-location database approach and the spectrum sensing ap-
istics such as location, antenna parameters (radiation pat- proach respectively. Some factors contribute to the optimal
tern, height above the ground), transmit power, times of op- performance of each approach. For example, geo-location
eration, protection requirements, allowed WSD transmitter database approach requires the following factors to perform
power, and other related parameters [6][7]. The database in- optimally in a region: propagation models whose prediction
(b) RF Explorer
(a) Geo-location database implementation
Figure 1: A simple geo-location database implementation and a Spectrum analyzer
– 210 –