
Page 88 - ITU Journal Future and evolving technologies Volume 2 (2021), Issue 6 – Wireless communication systems in beyond 5G era
P. 88
ITU Journal on Future and Evolving Technologies, Volume 2 (2021), Issue 6
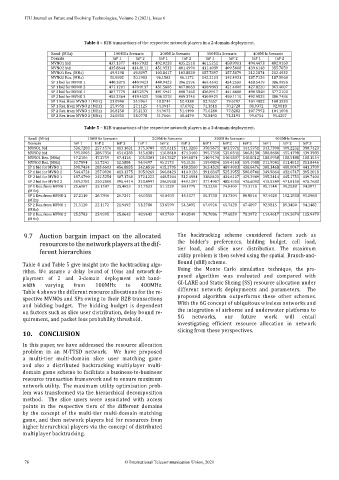
Table 4 – B2B transactions of the respective network players in a 2‑domain deployment.
Band. (MHz) 100MHz Scenario 200MHz Scenario 300MHz Scenario 400MHz Scenario
Domain InP 1 InP 2 InP 1 InP 2 InP 1 InP 2 InP 1 InP 2
MVNO1 bid 437.1377 416.7932 492.0228 435.2518 461.5252 458.9901 494.4473 402.9160
MVNO2 bid 435.8644 414.8111 451.9532 401.4996 411.4039 409.5608 439.6148 355.7059
MVNO1 Res. (MHz) 49.9198 49.8097 103.8417 103.8828 157.7897 157.5079 212.2874 212.4932
MVNO2 Res. (MHz) 50.0802 50.1903 96.1583 96.1172 142.2103 142.4921 187.7126 187.5068
SP 1 bid for MVNO 1 440.3875 440.9423 440.9423 396.2596 469.4542 454.2560 458.5419 386.9955
SP 1 bid for MVNO 2 471.1201 470.9137 451.5686 417.8063 438.9883 421.4086 427.8220 363.4007
SP 2 bid for MVNO 1 487.7779 443.2579 491.5941 408.7465 426.8917 441.6688 490.5848 377.2100
SP 2 bid for MVNO 2 455.3364 418.4525 506.1278 409.3748 430.8421 450.1110 492.9825 380.7486
SP 1 Res. from MVNO 1 (MHz) 23.0940 24.5964 48.8744 52.4338 82.7657 79.6797 104.4882 108.3238
SP 1 Res. from MVNO 2 (MHz) 25.9951 27.1125 44.3917 47.6702 71.3611 70.2728 88.0372 92.0810
SP 2 Res. from MVNO 1 (MHz) 26.8258 25.2133 54.9673 51.4490 75.0240 77.8282 107.7992 104.1694
SP 2 Res. from MVNO 2 (MHz) 24.0851 23.0778 51.7666 48.4470 70.8492 72.2193 99.6754 95.4257
Table 5 – B2B transactions of the respective network players in a 3‑domain deployment.
Band. (MHz) 100MHz Scenario 200MHz Scenario 300MHz Scenario 400MHz Scenario
Domain InP 1 InP 2 InP 3 InP 1 InP 2 InP 3 InP 1 InP 2 InP 3 InP 1 InP 2 InP 3
MVNO1 bid 536.7203 257.4576 413.1631 375.3789 455.6115 511.3260 350.5675 463.5971 444.5351 343.7390 409.2232 390.7423
MVNO2 bid 595.0003 286.7356 454.6280 345.4384 410.8810 474.3460 395.7358 525.0341 506.8130 388.8686 455.4798 439.3983
MVNO1 Res. (MHz) 47.2106 47.2759 47.4116 105.0303 104.7827 104.6874 140.9176 140.5837 140.8012 188.0958 188.5488 188.1554
MVNO2 Res. (MHz) 52.7894 52.7241 52.5884 94.9697 95.2173 95.3126 159.0824 159.4163 159.1988 211.9042 211.4512 211.8446
SP 1 bid for MVNO 1 598.7434 285.6603 456.8835 342.4516 415.2705 458.5560 363.4520 489.4903 458.6476 388.3468 480.0047 441.3709
SP 1 bid for MVNO 2 544.4724 257.0920 413.1375 305.9269 366.8423 414.9126 391.8347 525.3955 500.8746 349.9864 432.6747 395.2018
SP 2 bid for MVNO 1 497.4790 242.5254 387.1768 372.1222 448.5204 512.4984 338.8420 434.6107 429.3949 395.2414 445.1753 439.7404
SP 2 bid for MVNO 2 509.0781 250.2866 395.4414 323.4997 396.0938 449.1287 377.4907 488.4350 476.6092 415.5249 471.8150 475.7683
SP 1 Res. from MVNO 1 25.6987 25.1587 25.4623 51.7523 51.1228 50.1779 73.2250 74.8409 73.3115 95.1144 99.2038 94.0071
(MHz)
SP 1 Res. from MVNO 2 27.2110 26.7846 26.7241 46.0055 45.6403 45.4577 80.3738 81.7304 80.8016 97.4424 102.1838 95.8968
(MHz)
SP 2 Res. from MVNO 1 21.5120 22.1172 21.9492 53.2780 53.6599 54.5095 67.6926 65.7428 67.4897 92.9815 89.3450 94.1482
(MHz)
SP 2 Res. from MVNO 2 25.5783 25.9395 25.8643 48.9643 49.5769 49.8549 78.7086 77.6859 78.3972 114.4617 109.2674 115.9479
(MHz)
9.7 Auction bargain impact on the allocated as
resources tothe network players atthe dif‑ load,
ferent hierarchies maximum
utility problem is then solved using the spatial Branch-and-
Bound (sBB) scheme.
Table 4 and Table 5 give insight into the backtracking algo-
technique, pro-
network de-
posed algorithm was evaluated and compared with
ployment of 2 and 3‑domain deployment with band-
GI‑LARE and Static Slicing (SS) resource allocation under
width varying from 100MHz to 400MHz.
different network deployments and parameters. The
Table 4 shows the different resource allocations for the re‑
proposed algorithm outperforms these other schemes.
spective MVNOs and SPs owing to their B2B transactions
With the 6G concept of ubiquitous wireless networks and
and bidding budget. The bidding budget is dependent
the integration of airborne and underwater platforms to
on factors such as slice user distribution, delay bound re‑
quirement, and packet loss probability threshold. 5G networks, our future work will entail
investigating ef icient resource allocation in network
10. CONCLUSION slicing from these perspectives.
In this paper, we have addressed the resource allocation
problem in an M‑TTSD network. We have proposed
a multi‑tier multi‑domain slice user matching game
and also a distributed backtracking multiplayer multi‑
domain game scheme to facilitate a business‑to‑business
resource transaction framework and to ensure maximum
network utility. The maximum utility optimisation prob‑
lem was transformed via the hierarchical decomposition
method. The slice users were associated with access
points in the respective tiers of the different domains
by the concept of the multi‑tier multi‑domain matching
game, and then network players bid for resources from
higher hierarchical players via the concept of distributed
multiplayer backtracking.
76 © International Telecommunication Union, 2021