Page 85 - ITU Journal Future and evolving technologies Volume 2 (2021), Issue 6 – Wireless communication systems in beyond 5G era
P. 85

ITU Journal on Future and Evolving Technologies, Volume 2 (2021), Issue 6


                ×10 4                             ×10 4                            ×10 4
               2                               2.5
              1.8     MMM                              MMM                        3     MMM
              1.6                                                                2.5                4
                      GI-LARE                    2     GI-LARE                          GI-LARE  ×10
              1.4     Static                   1.5     Static  9000               2     Static  1.4
             Total Utility of the Network  0.8 1  6500  Total Utility of the Network  1  8000  Total Utility of the Network  1.5 1  1.2
              1.2
                                                                                               1.3
                                                                                               1.1
                           6000
              0.6
                                                            7000
                           5500
              0.4
                           5000
                                               0.5          6000                               0.9 1
                                                            5000
                           4500                                                  0.5           0.8
                              4   4.5  5                       4    5    6                       4   5    6
                     5        10       15              5       10       15              5        10       15
                  Slice User Average Arrival Rate  Slice User Average Arrival Rate   Slice User Average Arrival Rate
                (a) With a small cell density of 2  (b) With a small cell density of 3  (c) With a small cell density of 4
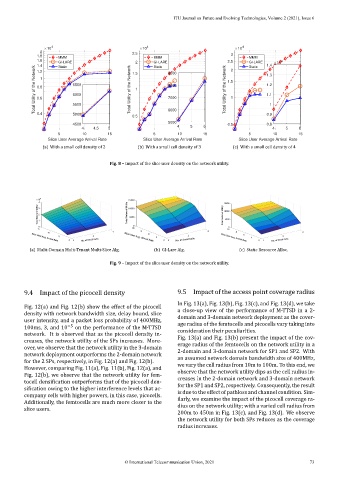
                                        Fig. 8 – Impact of the slice user density on the network utility.


              ×10 4                           15000
               4 3                                                              15000
               Total Network Utility  2 1      Total Network Utility  10000     Total Network Utility  10000
                                              5000
                                                                                5000
               0                                0                                0
              15                               10                                10
                                         4        8                       4         8                      4
                  10
                                                     6                                 6
                      5           3          Slice User Avg. Arrival Rate  4  3   Slice User Avg. Arrival Rate  4  3
                         0  2   No. of Small Cells        2  2   No. of Small Cells         2  2   No. of Small Cells
             Slice User Avg. Arrival Rate
           (a) Multi‑Domain Multi‑Tenant Multi‑Slice Alg.  (b) GI‑Lare Alg.          (c) Static Resource Alloc.
                                        Fig. 9 – Impact of the slice user density on the network utility.


          9.4  Impact of the picocell density                  9.5 Impact of the access point coverage radius
                                                               In Fig. 13(a), Fig. 13(b), Fig. 13(c), and Fig. 13(d), we take
          Fig.  12(a)  and  Fig.  12(b)  show  the  effect  of  the  picocell
                                                               a close‑up view of the performance of M‑TTSD in a 2‑
          density with network bandwidth size, delay bound, slice
                                                               domain and 3‑domain network deployment as the cover‑
          user intensity,  and a packet loss probability of 400MHz,   age radius of the femtocells and picocells vary taking into
          100ms,  3,  and  10 −5   on  the  performance  of  the  M‑TTSD
                                                               consideration their peculiarities.
          network.  It  is  observed  that  as  the  picocell  density  in‑
                                                               Fig. 13(a) and Fig. 13(b) present the impact of the cov‑
          creases,  the network utility of the SPs increases.  More‑
                                                               erage radius of the femtocells on the network utility in a
          over, we observe that the network utility in the 3‑domain
                                                               2‑domain and 3‑domain network for SP1 and SP2. With
          network deployment outperforms the 2‑domain network
                                                               an assumed network domain bandwidth size of 400MHz,
          for the 2 SPs, respectively, in Fig. 12(a) and Fig. 12(b).
                                                               we vary the cell radius from 10m to 100m. To this end, we
          However, comparing Fig. 11(a), Fig. 11(b), Fig. 12(a), and
                                                               observe that the network utility dips as the cell radius in‑
          Fig.  12(b),  we  observe  that  the  network  utility  for  fem‑
                                                               creases in the 2‑domain network and 3‑domain network
          tocell densi ication outperforms that of the picocell den‑
                                                               for the SP1 and SP2, respectively. Consequently, the result
          si ication owing to the higher interference levels that ac‑
                                                               is due to the effect of pathloss and channel condition. Sim‑
          company cells with higher powers, in this case, picocells.
                                                               ilarly, we examine the impact of the picocell coverage ra‑
          Additionally, the femtocells are much more closer to the   dius on the network utility; with a varied cell radius from
          slice users.
                                                               200m to 450m in Fig. 13(c), and Fig. 13(d). We observe
                                                               the network utility for both SPs reduces as the coverage
                                                               radius increases.

                                             © International Telecommunication Union, 2021                    73
   80   81   82   83   84   85   86   87   88   89   90