
Page 86 - ITU Journal Future and evolving technologies Volume 2 (2021), Issue 6 – Wireless communication systems in beyond 5G era
P. 86
ITU Journal on Future and Evolving Technologies, Volume 2 (2021), Issue 6
2000
SP1 100ms 2000 SP2 100ms 12000 SP1 InP2 12000 SP2 InP2
SP1 10ms SP2 10ms
1950 10000 SP1 InP3 10000 SP2 InP3
1960 1950
1970
1900 8000 8000
1940 1900 1960
SP1 Utility 1850 1920 SP2 Utility 1850 1950 SP1 Utility 6000 SP2 Utility 6000
1800
1900 1940
1750 1930 4000 4000
1800
1880
1920
1700
1860 1750 1910
150 200 250
1650 200 250 300
100 200 300 400 500 100 200 300 400 500 2000
InP Bandwidth InP Bandwidth 5 10 15 5 10 15
pico cell density pico cell density
(a) SP1 in a 2‑domain network. (b) SP2 in a 2‑domain network.
(a) SP1 in a 2 & 3‑domain network.(b) SP2 in a 2 & 3‑domain network.
SP1 100ms SP2 100ms Fig. 12 – Impact of the picocell density on the utility of the SPs .
3000 3000
SP1 10ms SP2 10ms
2950 2920 2950 3010
2900 2900 2900 3000
SP1 Utility 2850 2880 SP2 Utility 2850 2990
2800
2860 2800 2980 9000 9300 SP1 InP2 9000 9250 SP2 InP2
2970
2750 2750 SP1 InP3 SP2 InP3
2840 2960 8500 6140 8500 6150
2700 2700 9250
2820 2950 8000 6120 8000 9200
2650 150 200 250 2650 300 350 400
100 200 300 400 500 100 200 300 400 500 SP1 Utility 7500 9200 6100 SP2 Utility 7500
InP Bandwidth InP Bandwidth 9150 6100
(c) SP1 in a 3‑domain network. (d) SP2 in a 3‑domain network. 7000 9150 6080 7000
6060
6500 9100 6500 9100
Fig. 10 – Impact of the InP bandwidth on the utility of the SP at 10ms 20 40 60 6040 0 50 100 6050
and 100ms delay bound slice requirement. 20 40 60 6000 20 40 60
20 40 60 80 100 20 40 60 80 100
femto cell coverage radius,(m) femto cell coverage radius,(m)
(a) SP1 in a 2‑domain network. (b) SP2 in a 2‑domain network.
14000 14000
12000 SP1 InP2 12000 SP2 InP2 7500 7500
SP1 InP3 SP2 InP3 7680 SP1 InP2 7675 SP2 InP2
10000 10000 SP1 InP3
SP2 InP3
7000 7670 5105 7000 7670 5110
8000 8000 7660 7665
SP1 Utility 6000 SP2 Utility 6000 SP1 Utility 6500 7650 5100 SP2 Utility 6500 7660 5108
4000 4000 6000 7640 5095 6000 7655 5106
7630 5090 7650 5104
5500 5500
7620 7645
200 250 300 5085 200 250 300 5102
200 250 300 200 250
2000
5 10 15 5 10 15 200 250 300 350 400 450 200 250 300 350 400 450
Small cell density Small cell density pico cell coverage radius,(m) femto cell coverage radius,(m)
(a) SP1 in a 2 & 3‑domain network.(b) SP2 in a 2 & 3‑domain network. (c) SP1 in a 3‑domain network. (d) SP2 in a 3‑domain network.
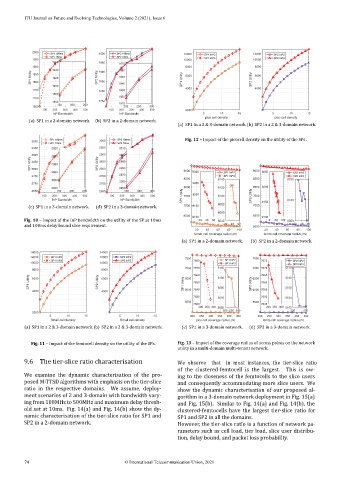
Fig. 11 – Impact of the femtocell density on the utility of the SPs. Fig. 13 – Impact of the coverage radius of access points on the network
utility in a multi‑domain multi‑tenant network.
9.6 The tier‑slice ratio characterisation ratio
of the clustered‑femtocell is the largest. This is ow‑
We examine the dynamic characterisation of the pro‑ ing to the closeness of the femtocells to the slice users
posed M‑TTSD algorithms with emphasis on the tier‑slice and consequently accommodating more slice users. We
ratio in the respective domains. We assume, deploy‑ show the dynamic characterisation of our proposed al‑
ment scenarios of 2 and 3‑domain with bandwidth vary‑ gorithm in a 3‑domain network deployment in Fig. 15(a)
ing from 100MHz to 500MHz and maximum delay thresh‑ and Fig. 15(b). Similar to Fig. 14(a) and Fig. 14(b), the
old set at 10ms. Fig. 14(a) and Fig. 14(b) show the dy‑ clustered‑femtocells have the largest tier‑slice ratio for
namic characterisation of the tier‑slice ratio for SP1 and SP1 and SP2 in all the domains.
SP2 in a 2‑domain network. However, the tier‑slice ratio is a function of network pa‑
rameters such as cell load, tier load, slice user distribu‑
tion, delay bound, and packet loss probability.
74 © International Telecommunication Union, 2021