
Page 84 - ITU Journal Future and evolving technologies Volume 2 (2021), Issue 6 – Wireless communication systems in beyond 5G era
P. 84
ITU Journal on Future and Evolving Technologies, Volume 2 (2021), Issue 6
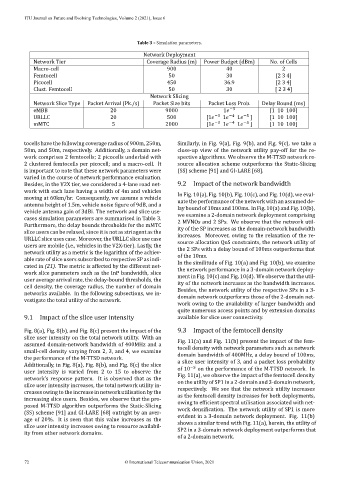
Table 3 – Simulation parameters.
Network Deployment
Network Tier Coverage Radius (m) Power Budget (dBm) No. of Cells
Macro‑cell 900 40 2
Femtocell 50 30 [2 3 4]
Picocell 450 36.9 [2 3 4]
Clust. Femtocell 50 30 [ 2 3 4]
Network Slicing
Network Slice Type Packet Arrival (Pk./s) Packet Size bits Packet Loss Prob. Delay Bound (ms)
eMBB 20 9000 1 −3 [1 10 100]
URLLC 20 500 [1 −3 1 −4 1 −5 ] [1 10 100]
mMTC 5 2000 [1 −3 1 −4 1 −5 ] [1 10 100]
tocells have the following coverage radius of 900m, 250m, Similarly, in Fig. 9(a), Fig. 9(b), and Fig. 9(c), we take a
50m, and 50m, respectively. Additionally, a domain net‑ close‑up view of the network utility pay‑off for the re‑
work comprises 2 femtocells; 2 picocells underlaid with spective algorithms. We observe the M‑TTSD network re‑
2 clustered femtocells per picocell; and a macro‑cell. It source allocation scheme outperforms the Static‑Slicing
is important to note that these network parameters were (SS) scheme [91] and GI‑LARE [68].
varied in the course of network performance evaluation.
Besides, in the V2X tier, we considered a 4‑lane road net‑ 9.2 Impact of the network bandwidth
work with each lane having a width of 4m and vehicles
In Fig. 10(a), Fig. 10(b), Fig. 10(c), and Fig. 10(d), we eval‑
moving at 60km/hr. Consequently, we assume a vehicle
uate the performance of the network with an assumed de‑
antenna height of 1.5m, vehicle noise igure of 9dB, and a
lay bound of 10ms and 100ms. In Fig. 10(a) and Fig. 10(b),
vehicle antenna gain of 3dBi. The network and slice use‑
we examine a 2‑domain network deployment comprising
cases simulation parameters are summarised in Table 3.
2 MVNOs and 2 SPs. We observe that the network util‑
Furthermore, the delay bounds thresholds for the mMTC
ity of the SP increases as the domain‑network bandwidth
slice users can be relaxed, since it is not as stringent as the
URLLC slice uses case. Moreover, the URLLC slice use case increases. Moreover, owing to the relaxation of the re‑
users are mobile (i.e., vehicles in the V2X‑tier). Lastly, the source allocation QoS constraints, the network utility of
network utility as a metric is the logarithm of the achiev‑ the 2 SPs with a delay bound of 100ms outperforms that
of the 10ms.
able rate of slice users subscribed to respective SP as indi‑
cated in (21). The metric is affected by the different net‑ In the similitude of Fig. 10(a) and Fig. 10(b), we examine
work slice parameters such as the InP bandwidth, slice the network performance in a 3‑domain network deploy‑
user average arrival rate, the delay‑bound thresholds, the ment in Fig. 10(c) and Fig. 10(d). We observe that the util‑
cell density, the coverage radius, the number of domain ity of the network increases as the bandwidth increases.
networks available. In the following subsections, we in‑ Besides, the network utility of the respective SPs in a 3‑
vestigate the total utility of the network. domain network outperforms those of the 2‑domain net‑
work owing to the availability of larger bandwidth and
quite numerous access points and by extension domains
9.1 Impact of the slice user intensity available for slice user connectivity.
Fig. 8(a), Fig. 8(b), and Fig. 8(c) present the impact of the 9.3 Impact of the femtocell density
slice user intensity on the total network utility. With an
Fig. 11(a) and Fig. 11(b) present the impact of the fem‑
assumed domain‑network bandwidth of 400MHz and a
tocell density with network parameters such as network
small‑cell density varying from 2, 3, and 4, we examine
domain bandwidth of 400MHz, a delay bound of 100ms,
the performance of the M‑TTSD network.
a slice user intensity of 3, and a packet loss probability
Additionally, in Fig. 8(a), Fig. 8(b), and Fig. 8(c) the slice −5
user intensity is varied from 2 to 15 to observe the of 10 on the performance of the M‑TTSD network. In
Fig. 11(a), we observe the impact of the femtocell density
network’s response pattern. It is observed that as the
on the utility of SP1 in a 2‑domain and 3‑domain network,
slice user intensity increases, the total network utility in‑
respectively. We see that the network utility increases
creases owing to the increase in network utilisation by the
increasing slice users. Besides, we observe that the pro‑ as the femtocell density increases for both deployments,
posed M‑TTSD algorithm outperforms the Static‑Slicing owing to ef icient spectral utilisation associated with net‑
(SS) scheme [91] and GI‑LARE [68] outright by an aver‑ work ication. The network utility of SP1 is more
age of 20%. It is seen that this value increases as the evident in a 3‑domain network deployment. Fig. 11(b)
slice user intensity increases owing to resource availabil‑ shows a similar trend with Fig. 11(a), herein, the utility of
SP2 in a 3‑domain network deployment outperforms that
ity from other network domains.
of a 2-domain network.
72 © International Telecommunication Union, 2021