
Page 22 - ITU Journal Future and evolving technologies Volume 2 (2021), Issue 4 – AI and machine learning solutions in 5G and future networks
P. 22
ITU Journal on Future and Evolving Technologies, Volume 2 (2021), Issue 4
Table 1 – Mean absolute percentage error (MAPE) for each modi ication step for ive runs: Last two columns denote the average and standard deviation of
each row.
Step Run 1 Run 2 Run 3 Run 4 Run 5 ̂ ̂
0 MSE 337 120 335 102 185 216 114
1* MAPE 26.4 64.1 43.7 36.9 60.9 46.4 16.0
2* Normalization 23.7 23.7 23.7 23.7 23.7 23.7 0.01
3* Variables 4.55 4.85 4.58 3.80 4.51 4.47 0.39
4* Residual connection 4.45 4.75 4.53 4.41 4.59 4.55 0.13
5* Stacked GRN 3.05 3.32 3.40 3.17 2.94 3.18 0.19
6A Dimension path and link state (64) 2.03 1.94 1.97 1.86 2.28 2.02 0.16
6B* Dimension path and link state (128) 1.68 1.63 1.52 1.58 1.57 1.60 0.06
6C Dimension path and link state (256) 2.65 2.99 3.00 3.19 2.48 2.86 0.29
7A* Neurons (128) 1.60 1.69 1.59 1.57 1.59 1.61 0.05
7B Neurons (256) 1.59 1.80 1.71 1.60 1.73 1.67 0.09
8A Decay rate (0.6/0.85) 1.42 1.61 1.37 1.42 1.52 1.47 0.10
8B* Decay rate (0.85) 1.35 1.34 1.32 1.49 1.30 1.36 0.08
* Variant selected for inal solution
Method 8A Method 8B
10 10
MAPE 5 MAPE 5
3 3
0 250 500 750 1000 1250 0 250 500 750 1000 1250
Step (in Thousands) Step (in Thousands)
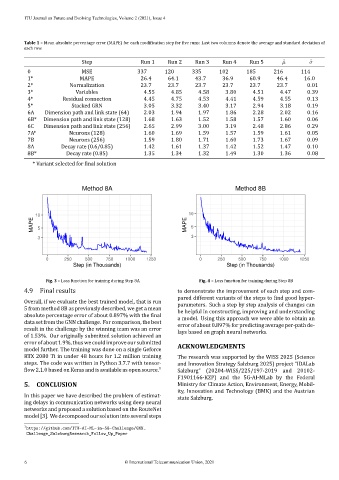
Fig. 3 – Loss function for training during Step 8A Fig. 4 – Loss function for training during Step 8B
4.9 Final results to demonstrate the improvement of each step and com‑
pared different variants of the steps to ind good hyper‑
Overall, if we evaluate the best trained model, that is run parameters. Such a step by step analysis of changes can
5 from method 8B as previously described, we get a mean be helpful in constructing, improving and understanding
absolute percentage error of about 0.897% with the inal a model. Using this approach we were able to obtain an
data set from the GNN challenge. For comparison, the best error of about 0.897% for predicting average per‑path de‑
result in the challenge by the winning team was an error lays based on graph neural networks.
of 1.53%. Our originally submitted solution achieved an
error ofabout 1.9%, thus we could improve our submitted ACKNOWLEDGMENTS
model further. The training was done on a single Geforce
RTX 2080 Ti in under 48 hours for 1.2 million training The research was supported by the WISS 2025 (Science
steps. The code was written in Python 3.7.7 with tensor‑ and Innovation Strategy Salzburg 2025) project ”IDALab
low 2.1.0 based on Keras and is available as open source. 1 Salzburg” (20204‑WISS/225/197‑2019 and 20102‑
F1901166‑KZP) and the 5G‑AI‑MLab by the Federal
5. CONCLUSION Ministry for Climate Action, Environment, Energy, Mobil‑
ity, Innovation and Technology (BMK) and the Austrian
In this paper we have described the problem of estimat‑ state Salzburg.
ing delays in communication networks using deep neural
networks and proposed a solution based on the RouteNet
model [3]. We decomposed our solution into several steps
1 https://github.com/ITU-AI-ML-in-5G-Challenge/GNN_
Challenge_SalzburgResearch_Follow_Up_Paper
6 © International Telecommunication Union, 2021