
Page 48 - ITU Journal: Volume 2, No. 1 - Special issue - Propagation modelling for advanced future radio systems - Challenges for a congested radio spectrum
P. 48
ITU Journal: ICT Discoveries, Vol. 2(1), December 2019
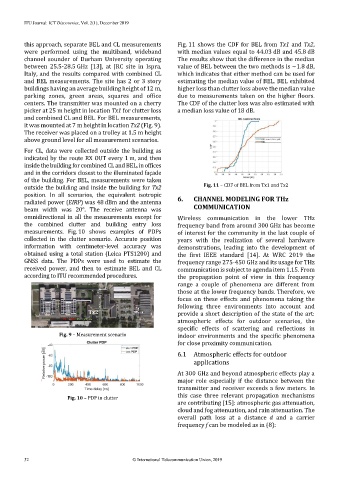
this approach, separate BEL and CL measurements Fig. 11 shows the CDF for BEL from Tx1 and Tx2,
were performed using the multiband, wideband with median values equal to 44.03 dB and 45.8 dB
channel sounder of Durham University operating The results show that the difference in the median
between 25.5-28.5 GHz [13], at JRC site in Ispra, value of BEL between the two methods is ~1.8 dB,
Italy, and the results compared with combined CL which indicates that either method can be used for
and BEL measurements. The site has 2 or 3 story estimating the median value of BEL. BEL exhibited
buildings having an average building height of 12 m, higher loss than clutter loss above the median value
parking zones, green areas, squares and office due to measurements taken on the higher floors.
centers. The transmitter was mounted on a cherry The CDF of the clutter loss was also estimated with
picker at 25 m height in location Tx1 for clutter loss a median loss value of 18 dB.
and combined CL and BEL. For BEL measurements,
it was mounted at 7 m height in location Tx2 (Fig. 9).
The receiver was placed on a trolley at 1.5 m height
above ground level for all measurement scenarios.
For CL, data were collected outside the building as
indicated by the route RX OUT every 1 m, and then
inside the building for combined CL and BEL, in offices
and in the corridors closest to the illuminated façade
of the building. For BEL, measurements were taken
outside the building and inside the building for Tx2 Fig. 11 – CDF of BEL from Tx1 and Tx2
position. In all scenarios, the equivalent isotropic
radiated power (EIRP) was 48 dBm and the antenna 6. CHANNEL MODELING FOR THz
beam width was 20°. The receive antenna was COMMUNICATION
omnidirectional in all the measurements except for Wireless communication in the lower THz
the combined clutter and building entry loss frequency band from around 300 GHz has become
measurements. Fig. 10 shows examples of PDPs of interest for the community in the last couple of
collected in the clutter scenario. Accurate position years with the realization of several hardware
information with centimeter-level accuracy was demonstrations, leading into the development of
obtained using a total station (Leica PTS1200) and the first IEEE standard [14]. At WRC 2019 the
GNSS data. The PDPs were used to estimate the frequency range 275-450 GHz and its usage for THz
received power, and then to estimate BEL and CL communication is subject to agenda item 1.15. From
according to ITU recommended procedures. the propagation point of view in this frequency
range a couple of phenomena are different from
those at the lower frequency bands. Therefore, we
focus on these effects and phenomena taking the
following three environments into account and
Tx2 Tx1 provide a short description of the state of the art:
Rx IN Rx Out atmospheric effects for outdoor scenarios, the
specific effects of scattering and reflections in
Fig. 9 – Measurement scenario indoor environments and the specific phenomena
for close proximity communication.
6.1 Atmospheric effects for outdoor
applications
At 300 GHz and beyond atmospheric effects play a
major role especially if the distance between the
transmitter and receiver exceeds a few meters. In
Fig. 10 – PDP in clutter this case three relevant propagation mechanisms
are contributing [15]: atmospheric gas attenuation,
cloud and fog attenuation, and rain attenuation. The
overall path loss at a distance and a carrier
frequency f can be modeled as in (8):
32 © International Telecommunication Union, 2019