
Page 140 - ITU KALEIDOSCOPE, ATLANTA 2019
P. 140
2019 ITU Kaleidoscope Academic Conference
Table 3 – Coefficients of predictors estimated by the three unsensitized patients, sensitized patients were expected to
regularized linear regression models (N=1034) incur 5.0% higher costs during the first year after transplant.
Furthermore, for a one-percent cost increase during the six-
Variables Ridge Lasso Elastic net month workup period and the one-year pre-workup period,
Female 0.0420 NS 0.0198 post-transplant costs at year one are expected to increase by
Age 81+ -0.531 -0.299 -0.350 0.38% and 0.09%, respectively. The lasso model also
identified age 61-70, age 81+, membership of LHIN K, and
Age 61-70 -0.129 -0.0574 -1.717 blood type B as predictors of lower costs at year one.
Asian -0.0399 NS -0.0156 Compared with patients who received a transplant at ages 71-
African American 0.0567 NS 0.0259 80, younger recipients aged 61-70 and older recipients
Other races 0.136 NS 0.101 beyond 80 years of age were found to cost 5.7% and nearly
LHIN B 0.00909 NS NS 30% (29.9%) less at year one, respectively. Furthermore,
LHIN C 0.0493 NS NS patients with blood type B were found to incur 1.6% less
LHIN D 0.0993 NS 0.0320 costs compared to type A patients during the first post-
LHIN E 0.0514 NS NS transplant year.
LHIN F -0.183 NS -0.0850
LHIN G 0.00247 NS NS The elastic net regression model concluded a total of 33
significant predictors of one-year costs, including all of the
LHIN H 0.0607 NS 0.00906 nine predictors identified by the lasso regression.
LHIN I 0.0769 NS 0.0347
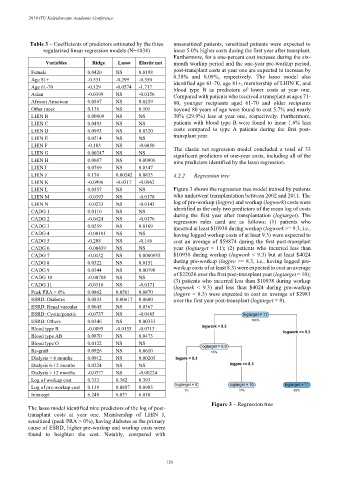
LHIN J 0.130 0.00242 0.0833 4.2.2 Regression tree
LHIN K -0.0996 -0.0317 -0.0962
LHIN L 0.0557 NS NS Figure 3 shows the regression tree model trained by patients
LHIN M -0.0393 NS -0.0178 who underwent transplantation between 2002 and 2011. The
LHIN N -0.0233 NS -0.0143 log of pre-workup (logpre) and workup (logwork) costs were
CADG 1 0.0110 NS NS identified as the only two predictors of the mean log of costs
CADG 2 -0.0424 NS -0.0176 during the first year after transplantation (logtarget). The
regression rules used are as follows: (1) patients who
CADG 3 0.0259 NS 0.0169 incurred at least $10938 during workup (logwork >= 9.3, i.e.,
CADG 4 -0.00101 NS NS having logged workup costs of at least 9.3) were expected to
CADG 5 -0.208 NS -0.146 cost an average of $59874 during the first post-transplant
CADG 6 -0.00439 NS NS year (logtarget = 11); (2) patients who incurred less than
CADG 7 -0.0432 NS 0.0000955 $10938 during workup (logwork < 9.3) but at least $4024
CADG 8 0.0322 NS 0.0151 during pre-workup (logpre >= 8.3, i.e., having logged pre-
CADG 9 0.0344 NS 0.00798 workup costs of at least 8.3) were expected to cost an average
CADG 10 -0.00708 NS NS of $22026 over the first post-transplant year (logtarget = 10);
(3) patients who incurred less than $10938 during workup
CADG 11 -0.0310 NS -0.0171 (logwork < 9.3) and less than $4024 during pre-workup
Peak PRA > 0% 0.0862 0.0501 0.0870 (logpre < 8.3) were expected to cost an average of $2981
ESRD: Diabetes 0.0833 0.00617 0.0600 over the first year post-transplant (logtarget = 8).
ESRD: Renal vascular 0.0645 NS 0.0367
ESRD: Cystic/genetic -0.0737 NS -0.0485
ESRD: Others 0.0346 NS 0.00333
Blood type B -0.0895 -0.0155 -0.0713
Blood type AB 0.0870 NS 0.0473
Blood type O 0.0122 NS NS
Re-graft 0.0926 NS 0.0610
Dialysis < 6 months 0.0912 NS 0.00205
Dialysis 6-12 months 0.0224 NS NS
Dialysis > 12 months -0.0377 NS -0.00224
Log of workup cost 0.333 0.382 0.393
Log of pre-workup cost 0.139 0.0887 0.0983
Intercept 6.248 6.037 6.010
Figure 3 – Regression tree
The lasso model identified nine predictors of the log of post-
transplant costs at year one. Membership of LHIN J,
sensitized (peak PRA > 0%), having diabetes as the primary
cause of ESRD, higher pre-workup and workup costs were
found to heighten the cost. Notably, compared with
– 120 –