
Page 138 - ITU KALEIDOSCOPE, ATLANTA 2019
P. 138
2019 ITU Kaleidoscope Academic Conference
I 177 (13.3%)
| | J 82 (6.2%)
2
∑ ∑ ( − ̂ ) + | |
=1 ∈ K 68 (5.1%)
L 86 (6.5%)
The size of the final tree, | |, is penalized by the complexity M 104 (7.8%)
parameter which is determined using ten-fold CV in the N 134 (10.1%)
training set to minimize the averaged RMSE. Comorbidities
CADG 1: Acute minor 906 (68.2%)
3.3 Sensitivity analysis CADG 2: Acute major 1220 (91.9%)
CADG 3: Likely to recur 809 (60.9%)
We conducted analysis to examine the impact of missing CADG 4: Asthma 75 (5.6%)
values on the primary results. Multiple imputation using CADG 5: Chronic medical, unstable 1310 (98.6%)
Markov-chain Monte Carlo (MCMC) methods, assuming
missing at random [28], was conducted to address patients CADG 6: Chronic medical, stable 873 (65.7%)
with missing peak PRA (N=237, 17.8%) and primary cause CADG 7: Chronic specialty, stable 51 (3.8%)
of ESRD (N=296, 22.3%), respectively. We repeated the CADG 8: Eye/dental 218 (16.4%)
imputation procedure ten times [28] and performed the CADG 9: Chronic specialty, unstable 185 (13.9%)
regression analysis on each of the ten newly imputed dataset. CADG 10: Psychosocial 228 (17.2%)
Analyses were performed using R (version 3.5.1). CADG 11: Preventive / administrative 614 (46.2%)
Sensitized (peak PRA > 0%) 548 (41.3%)
4. RESULTS Primary cause of ESRD
Glomerulonephritis / autoimmune 696 (52.4%)
4.1 Baseline characteristics Diabetes 246 (18.5%)
Renal vascular 158 (11.9%)
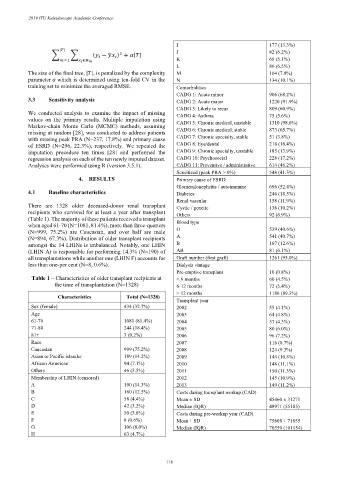
There are 1328 older deceased-donor renal transplant Cystic / genetic 136 (10.2%)
recipients who survived for at least a year after transplant Others 92 (6.9%)
(Table 1). The majority of these patients received a transplant
when aged 61-70 (N=1081, 81.4%), more than three-quarters Blood type
(N=999, 75.2%) are Caucasian, and over half are male O 539 (40.6%)
(N=894, 67.3%). Distribution of older transplant recipients A 541 (40.7%)
amongst the 14 LHINs is imbalanced. Notably, one LHIN B 167 (12.6%)
(LHIN A) is responsible for performing 14.3% (N=190) of AB 81 (6.1%)
all transplantations while another one (LHIN F) accounts for Graft number (first graft) 1261 (95.0%)
less than one-per cent (N=8, 0.6%). Dialysis vintage
Pre-emptive transplant 10 (0.8%)
Table 1 – Characteristics of older transplant recipients at < 6 months 60 (4.5%)
the time of transplantation (N=1328) 6-12 months 72 (5.4%)
> 12 months 1186 (89.3%)
Characteristics Total (N=1328)
Transplant year
Sex (female) 434 (32.7%) 2002 55 (4.1%)
Age 2003 64 (4.8%)
61-70 1081 (81.4%) 2004 57 (4.3%)
71-80 244 (18.4%) 2005 80 (6.0%)
81+ 3 (0.2%) 2006 96 (7.2%)
Race 2007 116 (8.7%)
Caucasian 999 (75.2%) 2008 124 (9.3%)
Asian or Pacific islander 189 (14.2%) 2009 144 (10.8%)
African American 94 (7.1%) 2010 148 (11.1%)
Others 46 (3.5%) 2011 150 (11.3%)
Membership of LHIN (censored) 2012 145 (10.9%)
A 190 (14.3%) 2013 149 (11.2%)
B 160 (12.5%) Costs during transplant workup (CAD)
C 58 (4.4%) Mean ± SD 45460 ± 31271
D 42 (3.2%) Median (IQR) 48971 (55185)
E 50 (3.8%) Costs during pre-workup year (CAD)
F 8 (0.6%) Mean ± SD 75608 ± 71855
G 106 (8.0%) Median (IQR) 70550 (101154)
H 63 (4.7%)
– 118 –