
Page 141 - ITU KALEIDOSCOPE, ATLANTA 2019
P. 141
ICT for Health: Networks, standards and innovation
4.3 Model validation calculators for older adults with chronic diseases. A further
implication of this finding points to the importance of
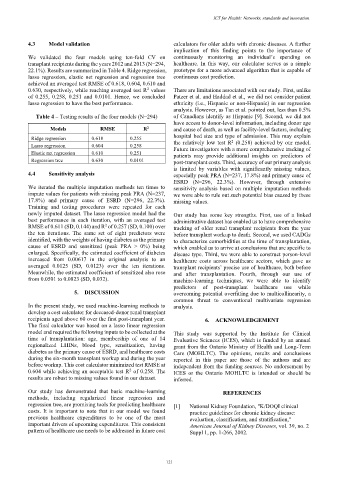
We validated the four models using ten-fold CV on continuously monitoring an individual’s spending on
transplant recipients during the years 2012 and 2013 (N=294, healthcare. In this way, our calculator serves as a simple
22.1%). Results are summarized in Table 4. Ridge regression, prototype for a more advanced algorithm that is capable of
lasso regression, elastic net regression and regression tree continuous cost prediction.
achieved an averaged test RMSE of 0.618, 0.604, 0.610 and
2
0.630, respectively, while reaching averaged test R values There are limitations associated with our study. First, unlike
of 0.255, 0.258, 0.251 and 0.0101. Hence, we concluded Patzer et al. and Haddad et al., we did not consider patient
lasso regression to have the best performance. ethnicity (i.e., Hispanic or non-Hispanic) in our regression
analysis. However, as Tan et al. pointed out, less than 0.5%
Table 4 – Testing results of the four models (N=294) of Canadians identify as Hispanic [9]. Second, we did not
have access to donor-level information, including donor age
Models RMSE R 2 and cause of death, as well as facility-level factors, including
Ridge regression 0.618 0.255 hospital bed size and type of admission. This may explain
2
Lasso regression 0.604 0.258 the relatively low test R (0.258) achieved by our model.
Future investigators with a more comprehensive tracking of
Elastic net regression 0.610 0.251 patients may provide additional insights on predictors of
Regression tree 0.630 0.0101 post-transplant costs. Third, accuracy of our primary analysis
is limited by variables with significantly missing values,
4.4 Sensitivity analysis especially peak PRA (N=237, 17.8%) and primary cause of
ESRD (N=296, 22.3%). However, through extensive
We iterated the multiple imputation methods ten times to sensitivity analysis based on multiple imputation methods
impute values for patients with missing peak PRA (N=237, we were able to rule out such potential bias caused by these
17.8%) and primary cause of ESRD (N=296, 22.3%). missing values.
Training and testing procedures were repeated for each
newly imputed dataset. The lasso regression model had the Our study has some key strengths. First, use of a linked
best performance in each iteration, with an averaged test administrative dataset has enabled us to have comprehensive
RMSE of 0.611 (SD, 0.144) and R of 0.257 (SD, 0.100) over tracking of older renal transplant recipients from the year
2
the ten iterations. The same set of eight predictors were before transplant workup to death. Second, we used CADGs
identified, with the weights of having diabetes as the primary to characterize comorbidities at the time of transplantation,
cause of ESRD and sensitized (peak PRA > 0%) being which enabled us to arrive at conclusions that are specific to
enlarged. Specifically, the estimated coefficient of diabetes disease type. Third, we were able to construct person-level
increased from 0.00617 in the original analysis to an healthcare costs across healthcare sectors, which gave us
averaged 0.0125 (SD, 0.0123) over the ten iterations. transplant recipients’ precise use of healthcare, both before
Meanwhile, the estimated coefficient of sensitized also rose and after transplantation. Fourth, through our use of
from 0.0501 to 0.0823 (SD, 0.032). machine-learning techniques, we were able to identify
predictors of post-transplant healthcare use while
5. DISCUSSION overcoming potential overfitting due to multicollinearity, a
common threat to conventional multivariate regression
In the present study, we used machine-learning methods to analysis.
develop a cost calculator for deceased-donor renal transplant
recipients aged above 60 over the first post-transplant year. 6. ACKNOWLEDGEMENT
The final calculator was based on a lasso linear regression
model and required the following inputs to be collected at the This study was supported by the Institute for Clinical
time of transplantation: age, membership of one of 14 Evaluative Sciences (ICES), which is funded by an annual
regionalized LHINs, blood type, sensitization, having grant from the Ontario Ministry of Health and Long-Term
diabetes as the primary cause of ESRD, and healthcare costs Care (MOHLTC). The opinions, results and conclusions
during the six-month transplant workup and during the year reported in this paper are those of the authors and are
before workup. This cost calculator minimized test RMSE at independent from the funding sources. No endorsement by
0.604 while achieving an acceptable test R of 0.258. The ICES or the Ontario MOHLTC is intended or should be
2
results are robust to missing values found in our dataset. inferred.
Our study has demonstrated that basic machine-learning REFERENCES
methods, including regularized linear regression and
regression tree, are promising tools for predicting healthcare [1] National Kidney Foundation, "K/DOQI clinical
costs. It is important to note that in our model we found practice guidelines for chronic kidney disease:
previous healthcare expenditures to be one of the most evaluation, classification, and stratification,"
important drivers of upcoming expenditures. This consistent American Journal of Kidney Diseases, vol. 39, no. 2
pattern of healthcare use needs to be addressed in future cost Suppl 1, pp. 1-266, 2002.
– 121 –