
Page 139 - ITU KALEIDOSCOPE, ATLANTA 2019
P. 139
ICT for Health: Networks, standards and innovation
Older transplant recipients in our cohort had a range of
comorbidities at the time of transplantation. Less than half of
them are sensitized (N=548, 41.3%). The most prevalent
cause of ESRD is glomerulonephritis/ autoimmune (N=696,
52.4%), followed by diabetes (N=246, 18.5%). Most patients
underwent a first-time renal transplantation (N=1261,
95.0%). Over forty-per cent of patients have blood type O
(N=539, 40.6%) and A (N=541, 40.7%), respectively. Most
transplantations were performed in 2011 (N=150, 11.3%).
There are ten (0.8%) pre-emptive transplantations, and the
majority of the remaining patients were transplanted after
maintaining on dialysis for over 12 months (N=1186, 89.3%).
Before receiving a transplant, total healthcare costs averaged
$45460 CAD (SD, $31271) over the six-month workup
period and $75608 CAD (SD, $71855) during the pre-
workup year.
Table 2 summarizes the total healthcare costs over the first
post-transplant year, stratified by age at transplant. Average Figure 1 – Plot showing the shrinkage of coefficients in
costs for all patients are $72723 CAD (SD, $63256) with ridge regression
median costs at $56819 CAD (IQR, $45568). Costs range
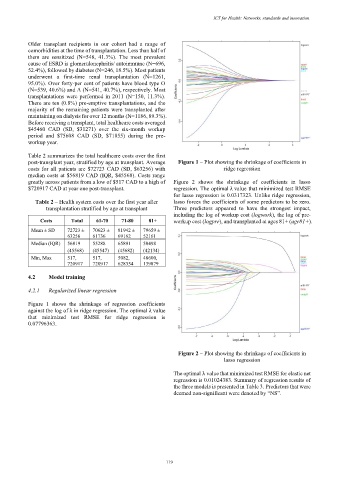
greatly across patients from a low of $517 CAD to a high of Figure 2 shows the shrinkage of coefficients in lasso
$720917 CAD at year one post-transplant. regression. The optimal λ value that minimized test RMSE
for lasso regression is 0.0317323. Unlike ridge regression,
Table 2 – Health system costs over the first year after lasso forces the coefficients of some predictors to be zero.
transplantation stratified by age at transplant Three predictors appeared to have the strongest impact,
including the log of workup cost (logwork), the log of pre-
Costs Total 61-70 71-80 81+ workup cost (logpre), and transplanted at ages 81+ (age81+).
Mean ± SD 72723 ± 70623 ± 81942 ± 79659 ±
63256 61736 69162 52161
Median (IQR) 56819 55288 65891 50498
(45568) (45547) (45682) (42134)
Min, Max 517, 517, 5082, 48600,
720917 720917 628354 139879
4.2 Model training
4.2.1 Regularized linear regression
Figure 1 shows the shrinkage of regression coefficients
against the log of λ in ridge regression. The optimal λ value
that minimized test RMSE for ridge regression is
0.07796363.
Figure 2 – Plot showing the shrinkage of coefficients in
lasso regression
The optimal λ value that minimized test RMSE for elastic net
regression is 0.01024383. Summary of regression results of
the three models is presented in Table 3. Predictors that were
deemed non-significant were denoted by “NS”.
– 119 –