
Page 131 - ITU KALEIDOSCOPE, ATLANTA 2019
P. 131
ICT for Health: Networks, standards and innovation
videos. Every frame in the dataset video is resized to 640 x
480 in order to maintain uniformity in feature dimension.
After applying HoG, the training sequences for LSTM are
generated by considering three consecutive frames and their
feature vectors. The output for this sequence is majority
voting of the ground truth values for each frame. These
sequences are passed as training input to the LSTM model
initialized with parameters as shown in Table 5.
The validation phase of the fall detector in Table 6, indicates
that the VPFD model has learnt to differentiate between fall
and non-fall sequences with high accuracy.
The accuracy comparison of various methods in Table 7
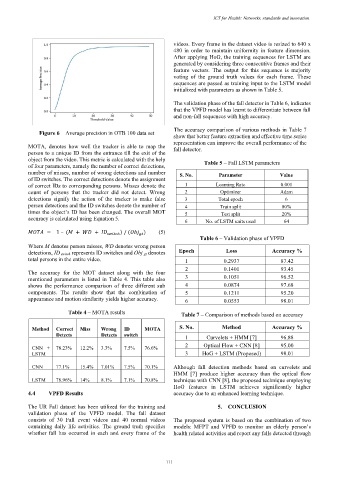
Figure 6 – Average precision in OTB 100 data set show that better feature extraction and effective time series
representation can improve the overall performance of the
MOTA, denotes how well the tracker is able to map the fall detector.
person to a unique ID from the entrance till the exit of the
object from the video. This metric is calculated with the help Table 5 – Fall LSTM parameters
of four parameters, namely the number of correct detections,
number of misses, number of wrong detections and number S. No. Parameter Value
of ID switches. The correct detections denote the assignment
of correct IDs to corresponding persons. Misses denote the 1 Learning Rate 0.001
count of persons that the tracker did not detect. Wrong 2 Optimizer Adam
detections signify the action of the tracker to make false 3 Total epoch 6
person detections and the ID switches denote the number of 4 Train split 80%
times the object’s ID has been changed. The overall MOT 5 Test split 20%
accuracy is calculated using Equation 5. 6 No. of LSTM units used 64
= 1 – ( + + ℎ ) / ( ) (5)
Table 6 – Validation phase of VPFD
Where M denotes person misses, WD denotes wrong person
detections, ID switch represents ID switches and Obj gt denotes Epoch Loss Accuracy %
total persons in the entire video. 1 0.2937 87.42
2 0.1401 93.45
The accuracy for the MOT dataset along with the four
mentioned parameters is listed in Table 4. This table also 3 0.1051 96.52
shows the performance comparison of three different sub 4 0.0874 97.68
components. The results show that the combination of 5 0.1211 95.20
appearance and motion similarity yields higher accuracy. 6 0.0553 98.01
Table 4 – MOTA results Table 7 – Comparison of methods based on accuracy
Method Correct Miss Wrong ID MOTA S. No. Method Accuracy %
Detects Detects switch 1 Curvelets + HMM [7] 96.88
CNN + 78.23% 12.2% 3.3% 7.5% 76.6% 2 Optical Flow + CNN [8] 95.00
LSTM 3 HoG + LSTM (Proposed) 98.01
CNN 77.1% 15.4% 7.01% 7.5% 70.1% Although fall detection methods based on curvelets and
HMM [7] produce higher accuracy than the optical flow
LSTM 78.96% 14% 8.1% 7.1% 70.8% technique with CNN [8], the proposed technique employing
HoG features in LSTM achieves significantly higher
4.4 VPFD Results accuracy due to an enhanced learning technique.
The UR Fall dataset has been utilized for the training and 5. CONCLUSION
validation phase of the VPFD model. The fall dataset
consists of 30 Fall event videos and 40 normal videos The proposed system is based on the combination of two
containing daily life activities. The ground truth specifies models: MFPT and VPFD to monitor an elderly person’s
whether fall has occurred in each and every frame of the health related activities and report any falls detected through
– 111 –