
Page 130 - ITU KALEIDOSCOPE, ATLANTA 2019
P. 130
2019 ITU Kaleidoscope Academic Conference
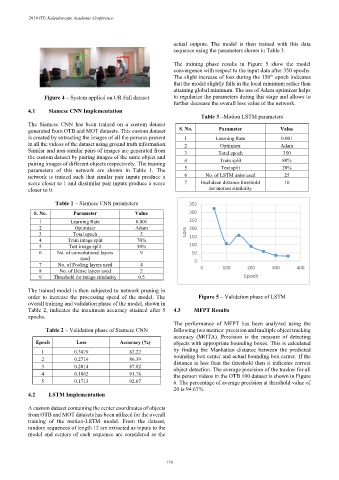
actual outputs. The model is then trained with this data
sequence using the parameters shown in Table 3.
The training phase results in Figure 5 show the model
convergence with respect to the input data after 350 epochs.
th
The slight increase of loss during the 150 epoch indicates
that the model slightly falls in the local minimum rather than
attaining global minimum. The use of Adam optimizer helps
Figure 4 – System applied on UR Fall dataset to regularize the parameters during this stage and allows to
further decrease the overall loss value of the network.
4.1 Siamese CNN Implementation
Table 3 –Motion LSTM parameters
The Siamese CNN has been trained on a custom dataset
generated from OTB and MOT datasets. This custom dataset S. No. Parameter Value
is created by extracting the images of all the persons present 1 Learning Rate 0.001
in all the videos of the dataset using ground truth information. 2 Optimizer Adam
Similar and non-similar pairs of images are generated from 3 Total epoch 350
the custom dataset by pairing images of the same object and 4 Train split 80%
pairing images of different objects respectively. The training
parameters of this network are shown in Table 1. The 5 Test split 20%
network is trained such that similar pair inputs produce a 6 No. of LSTM units used 25
score closer to 1 and dissimilar pair inputs produce a score 7 Euclidean distance threshold 10
closer to 0. for motion similarity
Table 1 – Siamese CNN parameters 350
S. No. Parameter Value 300
1 Learning Rate 0.001 250
2 Optimizer Adam 200
3 Total epoch 5 Loss
4 Train image split 70% 150
5 Test image split 30% 100
6 No. of convolutional layers 9 50
used
7 No. of Pooling layers used 4 0
8 No. of Dense layers used 2 0 100 200 300 400
9 Threshold for image similarity 0.5 Epoch
The trained model is then subjected to network pruning in
order to increase the processing speed of the model. The Figure 5 – Validation phase of LSTM
overall training and validation phase of the model, shown in
Table 2, indicates the maximum accuracy attained after 5 4.3 MFPT Results
epochs.
The performance of MFPT has been analyzed using the
Table 2 – Validation phase of Siamese CNN following two metrics: precision and multiple object tracking
accuracy (MOTA). Precision is the measure of detecting
Epoch Loss Accuracy (%) objects with appropriate bounding boxes. This is calculated
1 0.3879 82.22 by finding the Manhattan distance between the predicted
2 0.2716 86.39 bounding box center and actual bounding box center. If the
3 0.2014 87.82 distance is less than the threshold then it indicates correct
object detection. The average precision of the tracker for all
4 0.1862 91.78 the person videos in the OTB 100 dataset is shown in Figure
5 0.1713 92.07 6. The percentage of average precision at threshold value of
20 is 94.67%.
4.2 LSTM Implementation
A custom dataset containing the center coordinates of objects
from OTB and MOT datasets has been utilized for the overall
training of the motion-LSTM model. From the dataset,
random sequences of length 12 are extracted as inputs to the
model and centers of each sequence are considered as the
– 110 –