
Page 38 - Proceedings of the 2018 ITU Kaleidoscope
P. 38
2018 ITU Kaleidoscope Academic Conference
spectrum is not as affected as in the fifth. In C4, there is also
more variability around the cluster centroid.
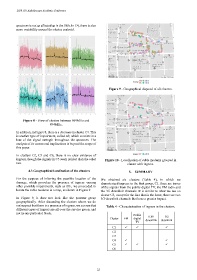
Figure 9 - Geographical disposal of all clusters.
Figure 8 - View of clusters between 869MHz and
894MHz.
In addition, in Figure 8, there is a decrease in cluster C4. This
is another type of impairment, called tilt, which consists in a
loss of the signal strength throughout the spectrum. The
analysis of its causes and implications is beyond the scope of
this paper.
In clusters C2, C3 and C6, there is no clear evidence of
ingress, though the signals in C3 seem noisier than the other Figure 10 - Localization of cable modems grouped in
two. cluster with ingress.
4.3 Geographical localization of the clusters 5. SUMMARY
For the purpose of inferring the possible location of the We obtained six clusters (Table 4), in which we
damage, which provokes the presence of ingress -among characterized ingress: in the first group, C1, there are traces
other possible impairments, such as tilt-, we proceeded to of the signals from the public digital TV, the FM radio and
locate the cable modems in a map, as shown in Figure 9. the 3G downlink channels. It is similar to what we see on
cluster C5, except for the fact that in the latter, there are two
In Figure 9, it does not look like the patterns group 3G-downlink channels that have a greater impact.
geographically. After discarding the clusters where we do
not suspect that there is a presence of ingress, we can see that Table 4 - Characterization of ingress in the clusters.
different types of ingress are all over the service group, and
not in one particular block.
Public LTE 3G
Cluster FM digital downlink downlink
TV
C1
C2
C3
C4
C5
C6
– 22 –