
Page 37 - Proceedings of the 2018 ITU Kaleidoscope
P. 37
Machine learning for a 5G future
According to Figure 6, there could be ingress in clusters C1
and C6.
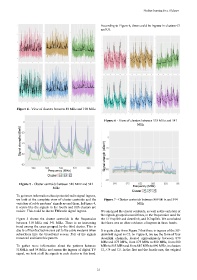
Figure 4 - View of clusters between 88 MHz and 108 MHz
Figure 6 - View of clusters between 518 MHz and 541
MHz
Figure 5 - Cluster centroids between 518 MHz and 541
MHz
To get more information about potential radio signal ingress,
we look at the complete view of cluster centroids and the Figure 7 - Cluster centroids between 869 MHz and 894
variation of cable modems’ signals around them. In Figure 4, MHz
it seems like the signals in the fourth and fifth clusters are
noisier. This could be due to FM radio signal ingress. We analyzed the cluster centroids, as well as the variation of
the signals grouped around them, in the frequencies used for
Figure 5 shows the cluster centroids in the frequencies the LTE uplink and downlink, and 3G uplink. We concluded
between 518 MHz and 541 MHz. There is an increasing that there was no clear evidence of ingress in these bands.
trend among the cases grouped by the third cluster. This is
due to a filter that technicians put to the cable modems when It is quite clear from Figure 7 that there is ingress of the 3G-
subscribers hire the broadband access. Part of the signals downlink signal in C5. In Figure 8, we see the form of four
transcend and form this pattern. downlink channels, located approximately between 870
MHz and 875 MHz, from 875 MHz to 880 MHz, from 880
To gather more information about the patterns between MHz to 885 MHz and from 885 MHz to 890 MHz, in clusters
518MHz and 541MHz and assess the ingress of digital TV C1, C4 and C5. In the first and the fourth case, the original
signal, we look at all the signals in each cluster in this band.
– 21 –