
Page 615 - 5G Basics - Core Network Aspects
P. 615
Transport aspects 2
9.2 Example of system performance evaluation
In this clause, the following conditions are assumed as an example model.
Wireless service: Cellular mobile communication
BS class (see [b-3GPP TS 36.104]): Local Area BS
RF signal: LTE or LTE-A
Length of SMF in ODN: 20 or 40 km
9.2.1 Single downlink signal transmission
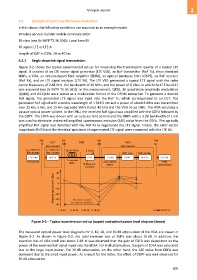
Figure 9-2 shows the typical experimental set-up for measuring the transmission quality of a typical LTE
signal. It consists of an LTE vector signal generator (LTE VSG), an RoF transmitter (RoF Tx), three standard
SMFs, a VOA, an erbium-doped fibre amplifier (EDFA), an optical bandpass filter (OBPF), an RoF receiver
(RoF Rx), and an LTE signal analyser (LTE SA). The LTE VSG generated a typical LTE signal with the radio
carrier frequency of 2.68 GHz, the bandwidth of 20 MHz, and the power of 0 dBm, in which the LTE band #7
was assumed (see [b-3GPP TS 36.101]). In this measurement, QPSK, 16 quadrature amplitude modulation
(QAM), and 64-QAM were tested as a modulation format of the OFDM subcarrier. To generate a desired
RoF signal, the generated LTE signal was input into the RoF Tx, which corresponded to an OLT. The
generated RoF signal with a centre wavelength of 1 549.5 nm and a power of about 6 dBm was transmitted
over 25 km, 5 km, and 15 km cascaded SMFs (total: 40 km) and the VOA to an ONU. The VOA emulates a
passive optical power splitter. In the ONU, the received RoF signal was amplified with the EDFA followed by
the OBPF. The EDFA was driven with an auto-current control and the OBPF with a 3 dB bandwidth of 1 nm
was used to eliminate undesired amplified spontaneous emission (ASE) noise from the EDFA. The optically
amplified RoF signal was detected with the RoF Rx to regenerate the LTE signal. Finally, the error vector
magnitude (EVM) and the electrical spectrum of regenerated LTE signal were measured with the LTE SA.
SNI S/R R/S UNI
OLT ODN ONU
E/O converter O/E converter
f : 2.68 GHz λ c : 1549.5 nm 25+5+10 km 0-30 dB
RF
BW: 20 MHz BW: 3 GHz BW: 1 nm BW: 3 GHz
LTE VSG RoF Tx VOA EDFA OBPF RoF Tx LTE SA
3 cascaded
LTE band #7 Auto-current EVM
SMFs Splitting loss control measurement
emulatio n
20
Measured optical power [dBm] –10 0
10
–20
–30
No reach extender
–40 (no optical amplifier)
0 dB 10 dB 20 dB 30 dB G Suppl.55(15)_F9-2
Figure 9-2 – Typical experimental set-up (upper) and optical power level diagram (lower)
The measured optical power level diagrams for 0, 10, 20, and 30 dB attenuation of the VOA are shown in
Figure 9-2. As shown in Figure 9-2, the total insertion loss of SMFs was about 10 dB. In addition, the
insertion loss of VOA itself was about 2 dB. It was observed that the gain of EDFA was dependent on the
power of the received RoF signal input into the EDFA. For 0 dB attenuation, the gain of EDFA was saturated
due to the large input power. For 30 dB attenuation, on the other hand, the ASE noise from EDFA was
dominant due to the small input power. As a result for the latter, the effect of OBPF was well observed for
30 dB attenuation.
605