
Page 122 - Kaleidoscope Academic Conference Proceedings 2022
P. 122
2022 ITU Kaleidoscope Academic Conference
3.2 Data collection and evaluation metric 4. RESULT AND DISCUSSION
The nature of data required for the experiment is AR Tables 2 and 3 provide the sample readings of how the
measurements. Measurements acquired from the tests are ARCore and ARKit devices are performing. AR calculations
compared to measurements captured with the control tape conducted over ARKit seem to be the most accurate when
measure. For consistency, the test environment was gauged against other devices running ARCore and the
controlled such that ambient lighting was kept constant control value. The best and worst results observed for each
throughout the tests, ensuring adequate lighting for plane device are also noted in the tables. The measurements taken
detection and AR measurements. with the tape measure (i.e. control) remained constant as
expected, and hence marked as N/A in the tables for each
Figure 6 depicts the practical use case of how the 100 cm distance criterion. The graphs of the readings were then
criteria was derived. A crime scene-related sample scenario plotted as shown in figures 7, 8, 9, 10, 11, 12, 13 and 14.
was used, where the knife’s handle represents point A and These graphs reveal the performance trend of the devices
the leg of the chair was used as point B (end point). The spanning ARCore and ARKit when compared to the control
distance between points A and B was set at 100cm using a measurement.
tape measure. The same approach was used to set the “10cm”,
“45cm” and “75cm” distance criteria. The crime scene use
case was considered to see how practical AR measurements
can assist with measuring crime scene evidence without the
risk of contamination by means of physically touching the
knife.
The accuracy of the AR frameworks was assessed based on
how close they could get to the control criteria. Six test runs
were conducted per device per measurement criteria. Four
measurement criteria were used, which are “10cm”, “45cm”,
“75cm” and “100cm” at a distance of one meter and two
meters across all tests. The average score ( � ) of each device
per measurement criteria after six test runs was then
computed using Equation (1).
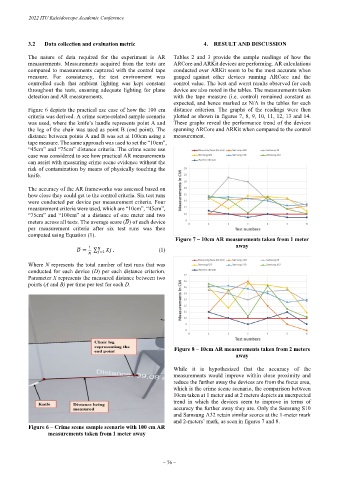
Figure 7 – 10cm AR measurements taken from 1 meter
away
1
� = ∑ . (1)
=1
Where N represents the total number of test runs that was
conducted for each device (D) per each distance criterion.
Parameter X represents the measured distance between two
points (A and B) per time per test for each D.
Figure 8 – 10cm AR measurements taken from 2 meters
away
While it is hypothesized that the accuracy of the
measurements would improve within close proximity and
reduce the further away the devices are from the focus area,
which is the crime scene scenario, the comparison between
10cm taken at 1 meter and at 2 meters depicts an unexpected
trend in which the devices seem to improve in terms of
accuracy the further away they are. Only the Samsung S10
and Samsung A32 retain similar scores at the 1-meter mark
and 2-meters’ mark, as seen in figures 7 and 8.
Figure 6 – Crime scene sample scenario with 100 cm AR
measurements taken from 1 meter away
– 76 –