
Page 125 - Kaleidoscope Academic Conference Proceedings 2022
P. 125
Extended reality – How to boost quality of experience and interoperability
The comparison between 100cm measurements taken at 1 the accuracy and reliability of all devices. Six devices were
meter and 2 meters reveals a trend in which the majority of used and five of those devices ran the application under the
the devices improved in terms of accuracy the further away ARCore framework, while one device ran the test under the
they are. The Samsung A20 and Samsung A32 devices ARKit framework. One device ran the test under ARKit due
decreased in accuracy scores at the 2-meter mark compared to the fact that the chosen device is the latest to house a
to the 1-meter mark as shown in figures 13 and 14. LiDAR scanner and has the best configurations for dynamic
ranging, which all the other ARCore devices do not have.
The average accuracy percentage scores for ARKit are Four measurement criteria were used, which are 10cm, 45cm,
measured by averaging the sum of the six scores per test and 75cm and 100cm at a distance of 1 meter and 2 meters across
comparing them to the control value per control criteria. The all tests. ARKit proved to be the most accurate and superior
same notion was used to calculate for ARCore. Based on all between the two frameworks by scoring an average accuracy
the conducted experiments, comparing the ARKit of 99.36%, as opposed to the 89.42% scored by ARCore. The
framework with ARCore framework, the following is noted: device running ARKit was the most accurate and reliable in
In Figure 7, ARKit scored an average accuracy of 96.70% seven out of the eight tests based on the criteria used. Figure
and ARCore obtained an average accuracy score of 59.5%. 9 illustrates the one occurrence where every device running
In Figure 8, ARKit scored an average accuracy score of 100% ARCore performed better than the device running ARKit.
and ARCore scored an average accuracy of 71.78%. In When conducting the tests, an unexpected trend occurred
Figure 9, ARKit scored an average accuracy of 100%, while whereby most of the devices seemed to improve in terms of
ARCore scored an average accuracy of 99.38%. In Figure 10, accuracy the further away they were from the target being
ARKit scored 99.27% and ARCore scored 99.63%. In Figure measured. Furthermore, the tests were conducted based on
11, ARKit scored 99.33% and ARCore scored 99.02%. In the applications built using the two AR frameworks, and
Figure 12, ARKit scored 99.78% and ARCore scored scientifically evaluated and benchmarked to gauge any
99.24%. In Figure 13, ARKit scored 100% and ARCore metric errors or bottleneck capabilities in determining AR
scored 94.70%. Lastly, in Figure 14 ARKit scored 99.83 and measurement outcomes. The results presented in this
ARCore 92.12%. research can guide future research on the choice of
framework to explore for prototyping and development of
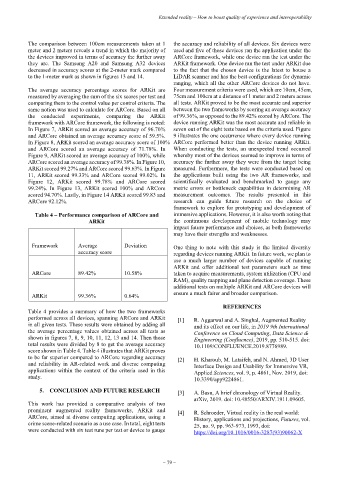
Table 4 – Performance comparison of ARCore and immersive applications. However, it is also worth noting that
ARKit the continuous development of mobile technology may
impact future performance and choices, as both frameworks
may have their strengths and weaknesses.
Framework Average Deviation One thing to note with this study is the limited diversity
accuracy score regarding devices running ARKit. In future work, we plan to
use a much larger number of devices capable of running
ARKit and offer additional test parameters such as time
ARCore 89.42% 10.58% taken to acquire measurements, system utilization (CPU and
RAM), quality mapping and plane detection coverage. These
additional tests on multiple ARKit and ARCore devices will
ARKit 99.36% 0.64% ensure a much fairer and broader comparison.
REFERENCES
Table 4 provides a summary of how the two frameworks
performed across all devices, spanning ARCore and ARKit [1] R. Aggarwal and A. Singhal, Augmented Reality
in all given tests. These results were obtained by adding all and its effect on our life, in 2019 9th International
the average percentage values obtained across all tests as Conference on Cloud Computing, Data Science &
shown in figures 7, 8, 9, 10, 11, 12, 13 and 14. Then those Engineering (Confluence), 2019, pp. 510-515. doi:
total results were divided by 8 to get the average accuracy 10.1109/CONFLUENCE.2019.8776989.
score shown in Table 4. Table 4 illustrates that ARKit proves
to be far superior compared to ARCore regarding accuracy [2] H. Kharoub, M. Lataifeh, and N. Ahmed, 3D User
and reliability in AR-related work and diverse computing Interface Design and Usability for Immersive VR,
applications within the context of the criteria used in this Applied Sciences, vol. 9, p. 4861, Nov. 2019, doi:
study. 10.3390/app9224861.
5. CONCLUSION AND FUTURE RESEARCH [3] A. Basu, A brief chronology of Virtual Reality.
arXiv, 2019. doi: 10.48550/ARXIV.1911.09605.
This work has provided a comparative analysis of two
prominent augmented reality frameworks, ARKit and [4] R. Schroeder, Virtual reality in the real world:
ARCore, aimed at diverse computing applications, using a History, applications and projections, Futures, vol.
crime scene-related scenario as a use case. In total, eight tests 25, no. 9, pp. 963-973, 1993, doi:
were conducted with six test runs per test or device to gauge https://doi.org/10.1016/0016-3287(93)90062-X
– 79 –