
Page 116 - Kaleidoscope Academic Conference Proceedings 2022
P. 116
2022 ITU Kaleidoscope Academic Conference
After peak staggering: four device key-frames no longer Table 3 – Peak staggered and full collision peak rate
collide and overlap, and each GOP cycle no longer overlaps, comparison
and device key-frames are evenly dispersed.
Peak rate Peak rate at Staggered
Video surveillance scenarios have high requirements for Number of when off- full collision peak drop
peak
real-time video. The real-time playback cache is usually Device (Mbps) (Mbps) (%)
between 100 and 200ms. If the network fluctuation is more
than 200ms, there will be visual stun, which requires the 1 11.2 11.2 0.00%
network to complete the sending of video frames within 4 23.2 44.8 48.2%
200ms. 7 35.2 78.4 55.1%
10 47.2 112.0 57.9%
Take the common video configuration FPS=25 and GOP=50 13 66.4 145.6 54.4%
as an example, then a video frame is generated every 40ms 14 70.4 156.8 55.1%
(FPS=25), and a key frame is generated every 50 frames
(GOP=50), and the period is 2000ms. In the 200ms where 16 78.4 179.2 56.2%
the key frame of a single device is located, the total number 30 141.6 336.0 57.9%
of frames=200ms/40ms=5; the rate=(1 I-frame data + 4 P- 31 152.8 347.2 56.0%
frame data)/200ms.
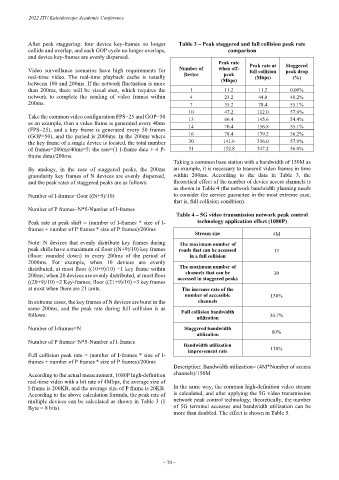
Taking a common base station with a bandwidth of 150M as
By analogy, in the case of staggered peaks, the 200ms an example, it is necessary to transmit video frames in time
granularity key frames of N devices are evenly dispersed, within 200ms. According to the data in Table 3, the
and the peak rates of staggered peaks are as follows: theoretical effect of the number of device access channels is
as shown in Table 4 (the network bandwidth planning needs
Number of I-frames=floor ((N+9)/10) to consider the service guarantee in the most extreme case,
that is, full collision condition).
Number of P frames=N*5-Number of I-frames
Table 4 – 5G video transmission network peak control
Peak rate at peak shift = (number of I-frames * size of I- technology application effect (1080P)
frames + number of P frames * size of P frames)/200ms
Stream size 4M
Note: N devices that evenly distribute key frames during The maximum number of
peak shifts have a maximum of floor ((N+9)/10) key frames roads that can be accessed 13
(floor: rounded down) in every 200ms of the period of in a full collision
2000ms. For example, when 10 devices are evenly
distributed, at most floor ((10+9)/10) =1 key frame within The maximum number of
channels that can be
200ms; when 20 devices are evenly distributed, at most floor accessed in staggered peaks 30
((20+9)/10) =2 Key-frames; floor ((21+9)/10) =3 key frames
at most when there are 21 units. The increase rate of the
number of accessible 130%
In extreme cases, the key frames of N devices are burst in the channels
same 200ms, and the peak rate during full collision is as Full collision bandwidth
follows: utilization 34.7%
Number of I-frames=N Staggered bandwidth
utilization 80%
Number of P frames=N*5-Number of I-frames
Bandwidth utilization
improvement rate 130%
Full collision peak rate = (number of I-frames * size of I-
frames + number of P frames * size of P frames)/200ms
Description: Bandwidth utilization= (4M*Number of access
According to the actual measurement, 1080P high-definition channels)/150M
real-time video with a bit rate of 4Mbps, the average size of
I-frame is 200KB, and the average size of P frame is 20KB. In the same way, the common high-definition video stream
According to the above calculation formula, the peak rate of is calculated, and after applying the 5G video transmission
multiple devices can be calculated as shown in Table 3 (1 network peak control technology, theoretically, the number
Byte = 8 bits). of 5G terminal accesses and bandwidth utilization can be
more than doubled. The effect is shown in Table 5.
– 70 –