
Page 181 - Kaleidoscope Academic Conference Proceedings 2021
P. 181
Connecting physical and virtual worlds
Window size: The length of a single window utilized during • FFT length: The Fast Fourier Transform size
training is measured in milliseconds. When the model is
• Low frequency: Lowest band edge of Mel–scale
trained, this much data is required to classify. It determines
filterbanks
the amount of the data that will be processed per classification,
in milliseconds. For instance, in this scenario, the wing beat • High frequency: Highest band edge of Mel–scale
of a mosquito is heard, most likely for one second, then it will filterbanks
be processed for 180 milliseconds.
• Window size: The size of sliding window for local
Window increase: Multiple windows of the sample are cepstral mean normalization, which corresponds to a
produced if the training data is larger than the window number of samples.
size. (For example, the mosquito wing beat is heard for
5 seconds, while the window length is one second.) The
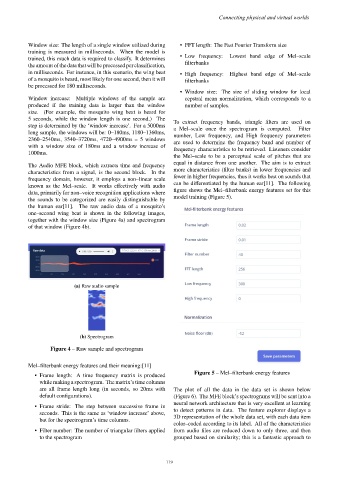
To extract frequency bands, triangle filters are used on
step is determined by the ‘window increase’. For a 5000ms
a Mel–scale once the spectrogram is computed. Filter
long sample, the windows will be: 0–180ms, 1180–1360ms,
number, Low frequency, and High frequency parameters
2360–2540ms, 3540–3720ms, 4720–4900ms = 5 windows
are used to determine the frequency band and number of
with a window size of 180ms and a window increase of
frequency characteristics to be retrieved. Listeners consider
1000ms.
the Mel–scale to be a perceptual scale of pitches that are
equal in distance from one another. The aim is to extract
The Audio MFE block, which extracts time and frequency
more characteristics (filter banks) in lower frequencies and
characteristics from a signal, is the second block. In the
fewer in higher frequencies, thus it works best on sounds that
frequency domain, however, it employs a non–linear scale
can be differentiated by the human ear[11]. The following
known as the Mel–scale. It works effectively with audio
figure shows the Mel–filterbank energy features set for this
data, primarily for non–voice recognition applications where
model training (Figure 5).
the sounds to be categorized are easily distinguishable by
the human ear[11]. The raw audio data of a mosquito’s
one–second wing beat is shown in the following images,
together with the window size (Figure 4a) and spectrogram
of that window (Figure 4b).
(a) Raw audio sample
(b) Spectrogram
Figure 4 – Raw sample and spectrogram
Mel–filterbank energy features and their meaning:[11]
Figure 5 – Mel–filterbank energy features
• Frame length: A time frequency matrix is produced
while making a spectrogram. The matrix’s time columns
are all frame length long (in seconds, so 20ms with The plot of all the data in the data set is shown below
default configurations). (Figure 6). The MFE block’s spectrograms will be sent into a
neural network architecture that is very excellent at learning
• Frame stride: The step between successive frame in
to detect patterns in data. The feature explorer displays a
seconds. This is the same as ‘window increase’ above,
3D representation of the whole data set, with each data item
but for the spectrogram’s time columns.
color–coded according to its label. All of the characteristics
• Filter number: The number of triangular filters applied from audio files are reduced down to only three, and then
to the spectrogram grouped based on similarity; this is a fantastic approach to
– 119 –