
Page 88 - ITUJournal Future and evolving technologies Volume 2 (2021), Issue 1
P. 88
ITU Journal on Future and Evolving Technologies, Volume 2 (2021), Issue 1
– Bio-geotechnical limits. According to the resolution to the problem of a shortage of resources,
“1 per cent” law, an artificial change of 1 per taking into account externalities, through planning
cent in the energy of a natural system as a rule and redistribution. From the analysis of the
causes it to depart from a Chatelier's technological process, of interdependencies
equilibrium [16]. In other words, our biota between industry sectors and of the economic
cannot compensate the volume of artificially impacts of spectrum usage, the inter-sector input-
generated energy that exceed 1 per cent of its output matrix for spectrum can be used as the
natural level. Experience of using other economic model for assessing spectrum efficiency.
natural resources suggests that violating that The proposed matrix for spectrum use is presented
rule may lead to catastrophic change in the in Table 2.
natural environment, such as global warming. Explanation of the values used in Table 2:
A part of solar energy transforms into a
natural electromagnetic field of the Earth n — number of users (i.e. industry sectors) or
forming a 1 per cent limit. An aggregate radio services using the spectrum (see Table
assessment of man-made emissions is 1 for example);
required when the strategy of spectrum use is k — spectrum allocation scenario;
defined to avoid transgressing this threshold. snk — aggregate spectrum allocation for the n-th
4. INPUT-OUTPUT ANALYSIS FOR user (radio service) in the k-th scenario. Here
SPECTRUM MANAGEMENT it must be understood that account needs to
be taken not only of the bandwidth directly
A definition of limits is just the first step of any accessible for the user, but also of other
economic analysis of efficient resource technical conditions and restrictions on its
management. Regulators should establish an utilization stemming from shared use. In
accurate economic model, enabling them to find an some cases, analysis of this component is
optimum scenario of development under conditions simplified thanks to the decisions on global or
of resource scarcity and negative externalities. regional spectrum harmonization for a
Nobel laureate W. Leontief pointed out that “the specific standard;
essence of input-output analysis in study of the
resources problem consists in constructing several Sk — aggregate spectrum allocations in the k-th
alternative scenarios with different combinations of scenario. Analysis of this value is complicated
input-output vectors describing the technological by the possibility of shared use of the
structure of the different methods of production spectrum, i.e. Sk ≠Σsnk;
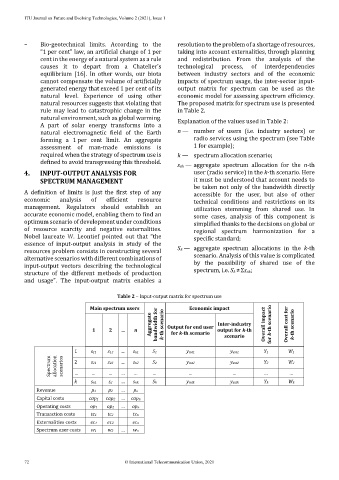
and usage”. The input-output matrix enables a
Table 2 – Input-output matrix for spectrum use
Main spectrum users Economic impact
Aggregate bandwidth for k-th scenario Output for end user Inter-industry Overall impact for k-th scenario Overall cost for k-th scenario
1 2 … n for k-th scenario output for k-th
scenario
1 s11 s12 ... sn1 S1 yint1 yext1 Y1 W1
Spectrum allocation scenarios 2 s21 s22 … sn2 S2 yint2 yext2 Y2 W2
...
…
…
…
…
…
…
…
…
…
k sn1 s2 … snk Sk yintk yextk Yk Wk
Revenue p1 p2 … pn
Capital costs cap1 cap2 … capn
Operating costs op1 op2 … opn
Transaction costs tc1 tc2 tcn
Externalities costs ec1 ec2 ecn
Spectrum user costs w1 w2 … wn
72 © International Telecommunication Union, 2021