
Page 70 - ITU Journal Future and evolving technologies Volume 2 (2021), Issue 7 – Terahertz communications
P. 70
ITU Journal on Future and Evolving Technologies, Volume 2 (2021), Issue 7
Fig. 11 shows the average of packet reachability, i.e. at 250 Flow 1
least one packet succeeding in reaching the destination Flow 2
node. We notice that packets are unable to reach the des‑ 200
tination for an awaken duration ranging from 5 to 20%.
This is due to the insuf icient number of awaken nodes es‑ 150
pecially in low density areas, the low propagation stops Number of sent packets
at the beginning. Recall that we are testing in a heteroge‑ 100
neous network, where areas’ densities are different. 50 0 0 10 20 30 40 50 60 70 80 90 100
Average of packets reception (%) 80 Fig. 12 – The number of packets sent varies with node awaken duration.
100
Flow 1
Flow 2
% Awaken duration
60
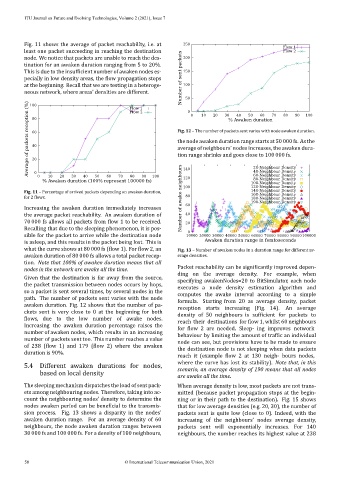
the node awaken duration range starts at 50 000 fs. As the
40
average of neighbours’ nodes increases, the awaken dura‑
tion range shrinks and goes close to 100 000 fs.
20
20-Neighbour Density
40-Neighbour Density
0
60-Neighbour Density
0
60
50
70
90
80
40
20
10
30
120
80-Neighbour Density
% Awaken duration (100% represent 100000 fs) 100 140 100-Neighbour Density
140-Neighbour Density
Fig. 11 – Percentage of arrived packets depending on awaken duration, 100 120-Neighbour Density
160-Neighbour Density
for 2 lows. Number of awake neighbours 80 180-Neighbour Density
190-Neighbour Density
Increasing the awaken duration immediately increases 60
the average packet reachability. An awaken duration of 40
70 000 fs allows all packets from low 1 to be received. 20
Recalling that due to the sleeping phenomenon, it is pos‑ 0
sible for the packet to arrive while the destination node 10000 20000 30000 40000 50000 60000 70000 80000 90000 100000
Awaken duration range in femtoseconds
is asleep, and this results in the packet being lost. This is
what the curve shows at 80 000 fs ( low 1). For low 2, an Fig. 13 – Number of awaken nodes in a duration range for different av‑
awaken duration of 80 000 fs allows a total packet recep‑ erage densities.
tion. Note that 100% of awaken duration means that all
nodes in the network are awake all the time. Packet reachability can be signi icantly improved depen-
ding on the average density. For example, when
Given that the destination is far away from the source,
specifying awakenNodes=20 to BitSimulator, each node
the packet transmission between nodes occurs by hops,
executes a node density estimation algorithm and
so a packet is sent several times, by several nodes in the
computes the awake interval according to a simple
path. The number of packets sent varies with the node
formula. Starting from 20 as average density, packet
awaken duration. Fig. 12 shows that the number of pa-
reception starts increasing (Fig. 14). An average
ckets sent is very close to 0 at the beginning for both
density of 50 neighbours is icient for packets to
lows, due to the low number of awake nodes.
reach their destinations for low 1, whilst 60 neighbours
Increasing the awaken duration percentage raises the
for low 2 are needed. Sleep‑ ing improves network
number of awaken nodes, which results in an increasing
behaviour by limiting the amount of traf ic an individual
number of packets sent too. This number reaches a value
node can see, but provisions have to be made to ensure
of 238 ( low 1) and 179 ( low 2) where the awaken the destination node is not sleeping when data packets
duration is 90%.
reach it (example low 2 at 130 neigh‑ bours nodes,
where the curve has lost its stability). Note that, in this
5.4 Different awaken durations for nodes, scenario, an average density of 190 means that all nodes
based on local density
are awake all the time.
The sleeping mechanism dispatches the load of sent pack‑ When average density is low, most packets are not trans‑
ets among neighbouring nodes. Therefore, taking into ac‑ mitted (because packet propagation stops at the begin‑
count the neighbouring nodes’ density to determine the ning or in their path to the destination). Fig. 15 shows
nodes awaken period can be bene icial to the transmis‑ that for low average densities (e.g. 20, 30), the number of
sion process. Fig. 13 shows a disparity in the nodes’ packets sent is quite low (close to 0). Indeed, with the
awaken duration range. For an average density of 60 increasing of the neighbours’ nodes average density,
neighbours, the node awaken duration ranges between packets sent will exponentially increases. For 140
30 000 fs and 100 000 fs. For a density of 100 neighbours, neighbours, the number reaches its highest value at 238
58 © International Telecommunication Union, 2021