
Page 69 - ITU Journal Future and evolving technologies Volume 2 (2021), Issue 7 – Terahertz communications
P. 69
ITU Journal on Future and Evolving Technologies, Volume 2 (2021), Issue 7
Table 1 – Simulation parameters
has been proven to work, and has contributed to impro-
ving the nodes’ energy consumption as well as Size of simulated network 6 mm * 6 mm
increasing network lifetime.
Size of rectangles 6 mm * 2 mm
Nano‑networks have different applications in various Number of nodes 4500
ields, extending from environment monitoring, indus‑ Communication radius 500 µm
trial manufacturing, and agriculture to an enormous num‑ Hops to reach the furthest node 17
ber of applications in medicine (like drug delivery, diag‑ (time spreading ratio) 1000
nostics and surgical operations). 100 fs
Nowadays, the health sector is one of the most impor‑
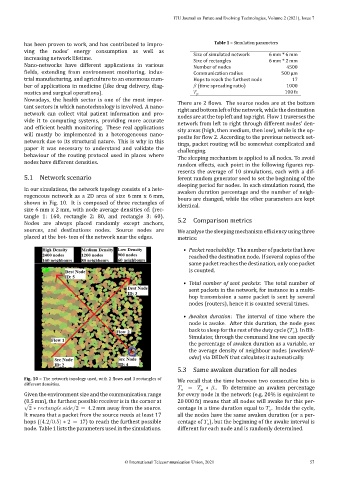
There are 2 lows. The source nodes are at the bottom
tant sectors in which nanotechnology is involved. A nano‑
right and bottom left of the network, while the destination
network can collect vital patient information and pro‑
nodes are at the top left and top right. Flow 1 traverses the
vide it to computing systems, providing more accurate
network from left to right through different nodes’ den‑
and ef icient health monitoring. These real applications
sity areas (high, then medium, then low), while is the op‑
will mostly be implemented in a heterogeneous nano‑
posite for low 2. According to the previous network set‑
network due to its structural nature. This is why in this
tings, packet routing will be somewhat complicated and
paper it was necessary to understand and validate the
challenging.
behaviour of the routing protocol used in places where The sleeping mechanism is applied to all nodes. To avoid
nodes have different densities. random effects, each point in the following igures rep‑
resents the average of 10 simulations, each with a dif‑
5.1 Network scenario ferent random generator seed to set the beginning of the
sleeping period for nodes. In each simulation round, the
In our simulations, the network topology consists of a hete‑
awaken duration percentage and the number of neigh‑
rogeneous network as a 2D area of size 6 mm x 6 mm,
bours are changed, while the other parameters are kept
shown in Fig. 10. It is composed of three rectangles of
identical.
size 6 mm x 2 mm, with node average densities of: (rec-
tangle 1: 160, rectangle 2: 80, and rectangle 3: 60).
5.2 Comparison metrics
Nodes are always placed randomly except anchors,
sources, and destinations nodes. Source nodes are We analyse the sleeping mechanism ef iciency using three
placed at the bot‑ tom of the network near the edges. metrics:
• Packet reachability: The number of packets that have
reached the destination node. If several copies of the
same packet reaches the destination, only one packet
is counted.
• Total number of sent packets: The total number of
sent packets in the network, for instance in a multi‑
hop transmission a same packet is sent by several
nodes (routers), hence it is counted several times.
• Awaken duration: The interval of time where the
node is awake. After this duration, the node goes
back to sleep for the rest of the duty cycle ( ). In Bit‑
Simulator, through the command line we can specify
the percentage of awaken duration as a variable, or
the average density of neighbour nodes (awakenN‑
odes) via DEDeN that calculates it automatically.
5.3 Same awaken duration for all nodes
Fig. 10 – The network topology used, with 2 lows and 3 rectangles of We recall that the time between two consecutive bits is
different densities.
= ∗ .. To determine an awaken percentage
Given the environment size and the communication range for every node in the network (e.g. 20% is equivalent to
(0.5 mm), the furthest possible receiver is in the corner at 20 000 fs) means that all nodes will awake for this per‑
√
2 ∗ /2 = 4.2 mm away from the source. centage in a time duration equal to . Inside the cycle,
It means that a packet from the source needs at least 17 all the nodes have the same awaken duration (or a per‑
hops ((4.2/0.5) ∗ 2 = 17) to reach the furthest possible centage of ), but the beginning of the awake interval is
node. Table 1 lists the parameters used in the simulations. different for each node and is randomly determined.
© International Telecommunication Union, 2021 57