
Page 20 - ITU Journal Future and evolving technologies Volume 2 (2021), Issue 5 – Internet of Everything
P. 20
ITU Journal on Future and Evolving Technologies, Volume 2 (2021), Issue 5
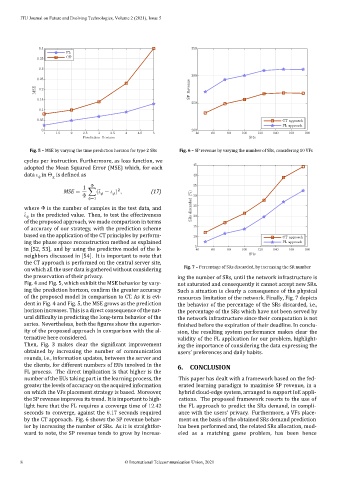
Fig. 5 – MSE by varying the time prediction horizon for type 2 SRs Fig. 6 – SP revenue by varying the number of SRs, considering 10 VFs
cycles per instruction. Furthermore, as loss function, we
adopted the Mean Squared Error (MSE) which, for each
data in Θ is de ined as
1 Φ
2
MSE = ∑( ̂ − ) , (17)
Φ
=1
where Φ is the number of samples in the test data, and
̂ is the predicted value. Then, to test the effectiveness
of the proposed approach, we made comparison in terms
of accuracy of our strategy, with the prediction scheme
based on the application of the CT principles by perform‑
ing the phase space reconstruction method as explained
in [52, 53], and by using the predictive model of the k‑
neighbors discussed in [54]. It is important to note that
the CT approach is performed on the central server site,
Fig. 7 – Percentage of SRs discarded, by increasing the SR number
on which all the user data is gathered without considering
the preservation of their privacy. ing the number of SRs, until the network infrastructure is
Fig. 4 and Fig. 5, which exhibit the MSE behavior by vary‑ not saturated and consequently it cannot accept new SRs.
ing the prediction horizon, con irm the greater accuracy Such a situation is clearly a consequence of the physical
of the proposed model in comparison to CT. As it is evi‑ resources limitation of the network. Finally, Fig. 7 depicts
dent in Fig. 4 and Fig. 5, the MSE grows as the prediction the behavior of the percentage of the SRs discarded, i.e.,
horizon increases. This is a direct consequence of the nat‑ the percentage of the SRs which have not been served by
ural dif iculty in predicting the long‑term behavior of the the network infrastructure since their computation is not
series. Nevertheless, both the igures show the superior‑ inished before the expiration of their deadline. In conclu‑
ity of the proposed approach in comparison with the al‑ sion, the resulting system performance makes clear the
ternative here considered. validity of the FL application for our problem, highlight‑
Then, Fig. 3 makes clear the signi icant improvement ing the importance of considering the data expressing the
obtained by increasing the number of communication users’ preferences and daily habits.
rounds, i.e., information updates, between the server and
6. CONCLUSION
the clients, for different numbers of EUs involved in the
FL process. The direct implication is that higher is the
number of the EUs taking part in the learning process, the This paper has dealt with a framework based on the fed‑
greater the levels of accuracy on the acquired information erated learning paradigm to maximise SP revenue, in a
on which the VFs placement strategy is based. Moreover, hybrid cloud‑edge system, arranged to support IoE appli‑
the SP revenue improves its trend. It is important to high‑ cations. The proposed framework resorts to the use of
light here that the FL requires a converge time of 12.42 the FL approach to predict the SRs demand, in compli‑
seconds to converge, against the 6.17 seconds required ance with the users’ privacy. Furthermore, a VFs place‑
by the CT approach. Fig. 6 shows the SP revenue behav‑ ment on the basis of the obtained SRs demand prediction
ior by increasing the number of SRs. As it is straightfor‑ has been performed and, the related SRs allocation, mod‑
ward to note, the SP revenue tends to grow by increas‑ eled as a matching game problem, has been hence
8 © International Telecommunication Union, 2021