
Page 91 - ITU Journal Future and evolving technologies Volume 2 (2021), Issue 4 – AI and machine learning solutions in 5G and future networks
P. 91
ITU Journal on Future and Evolving Technologies, Volume 2 (2021), Issue 4
As shown, the proposed ML mechanisms provide general
accurate predictions; most of the error values are in the
range of 0 to 10 Mbps. This means that, even in the pres‑
ence of outliers, the predictions provided by the ML mod‑
els are suitable for a signi icant percentage of the deploy‑
ments. The accuracy of the different models proposed by
ATARI, STC, and NET INTELS can be further observed in
Table 4, which shows the percentage of the throughput
predictions for STAs achieving an error below 10 Mbps.
Table 4 – Percentage of per‑STA predictions achieving <10 Mbps error.
Information is provided for ATARI, STC, and NET INTELS results.
test1 test2 test3 test4
ATARI 36.97% 55.81% 67.01% 77.40%
STC 55.97% 56.27% 56.74% 60.67%
NET INTELS 38.09% 42.15% 44.01% 49.77%
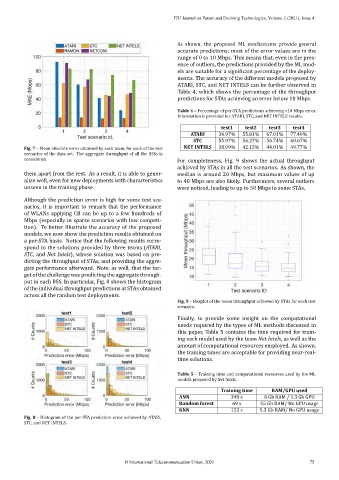
Fig. 7 – Mean absolute error obtained by each team, for each of the test
scenarios of the data set. The aggregate throughput of all the BSSs is
considered. For completeness, Fig. 9 shows the actual throughput
achieved by STAs in all the test scenarios. As shown, the
them apart from the rest. As a result, it is able to gener‑ median is around 20 Mbps, but maximum values of up
alize well, even for new deployments with characteristics to 40 Mbps are also likely. Furthermore, several outliers
unseen in the training phase. were noticed, leading to up to 50 Mbps in some STAs.
Although the prediction error is high for some test sce‑
narios, it is important to remark that the performance
of WLANs applying CB can be up to a few hundreds of
Mbps (especially in sparse scenarios with low competi‑
tion). To better illustrate the accuracy of the proposed
models, we now show the prediction results obtained on
a per‑STA basis. Notice that the following results corre‑
spond to the solutions provided by three teams (ATARI,
STC, and Net Intels), whose solution was based on pre‑
dicting the throughput of STAs, and providing the aggre‑
gate performance afterward. Note, as well, that the tar‑
get of the challenge was predicting the aggregate through‑
put in each BSS. In particular, Fig. 8 shows the histogram
of the individual throughput predictions at STAs obtained
across all the random test deployments.
Fig. 9 – Boxplot of the mean throughput achieved by STAs for each test
scenario.
Finally, to provide some insight on the computational
needs required by the types of ML methods discussed in
this paper, Table 5 contains the time required for train‑
ing each model used by the team Net Intels, as well as the
amount of computational resources employed. As shown,
the training times are acceptable for providing near‑real‑
time solutions.
Table 5 – Training time and computational resources used by the ML
models proposed by Net Intels.
Training time RAM/GPU used
ANN 349 s 8 Gb RAM / 1.3 Gb GPU
Random forest 69 s 55 Gb RAM/ No GPU usage
KNN 122 s 5.3 Gb RAM/ No GPU usage
Fig. 8 – Histogram of the per‑STA prediction error achieved by ATARI,
STC, and NET INTELS.
© International Telecommunication Union, 2021 75