
Page 87 - ITU Journal Future and evolving technologies Volume 2 (2021), Issue 4 – AI and machine learning solutions in 5G and future networks
P. 87
ITU Journal on Future and Evolving Technologies, Volume 2 (2021), Issue 4
5. Channels range: minimum and maximum channels Therefore, we select a GNN approach to predict the
allowed for bonding. throughput of the devices in a WLAN. In particular, each
6. Transmit power: power used for transmitting deployment is considered as a directed graph where STAs
frames. and APs are the graph’s nodes. Additionally, we de ine
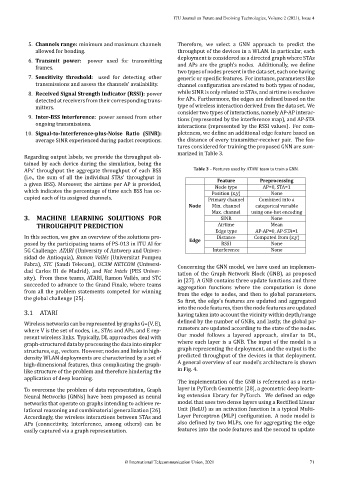
twotypesofnodespresentinthedataset, eachonehaving
7. Sensitivity threshold: used for detecting other generic or speci ic features. For instance, parameters like
transmissions and assess the channels’ availability. channel con iguration are related to both types of nodes,
while SINR is only related to STAs, and airtime is exclusive
8. Received Signal Strength Indicator (RSSI): power
for APs. Furthermore, the edges are de ined based on the
detected at receivers from their corresponding trans‑
mitters. type of wireless interaction derived from the data set. We
consider two types of interactions, namely AP‑AP interac‑
9. Inter‑BSS interference: power sensed from other
tions (represented by the interference map), and AP‑STA
ongoing transmissions.
interactions (represented by the RSSI values). For com‑
10. Signal‑to‑Interference‑plus‑Noise Ratio (SINR): pleteness, we de ine an additional edge feature based on
average SINR experienced during packet receptions. the distance of every transmitter‑receiver pair. The fea‑
tures considered for training the proposed GNN are sum‑
marized in Table 3.
Regarding output labels, we provide the throughput ob‑
tained by each device during the simulation, being the
APs’ throughput the aggregate throughput of each BSS Table 3 – Features used by ATARI team to train a GNN.
(i.e., the sum of all the individual STAs’ throughput in
Feature
a given BSS). Moreover, the airtime per AP is provided, Node type Preprocessing
AP=0, STA=1
which indicates the percentage of time each BSS has oc‑ Position (x,y) None
cupied each of its assigned channels. Primary channel Combined into a
Node Min. channel categorical variable
Max. channel using one‑hot encoding
3. MACHINE LEARNING SOLUTIONS FOR SINR None
THROUGHPUT PREDICTION Airtime Mean
Edge type AP‑AP=0, AP‑STA=1
In this section, we give an overview of the solutions pro‑ Distance Computed from (x,y)
posed by the participating teams of PS‑013 in ITU AI for Edge RSSI None
5G Challenge: ATARI (University of Antwerp and Univer‑ Interference None
sidad de Antioquia), Ramon Vallés (Universitat Pompeu
Fabra), STC (Saudi Telecom), UC3M NETCOM (Universi‑
Concerning the GNN model, we have used an implemen‑
dad Carlos III de Madrid), and Net Intels (PES Univer‑
tation of the Graph Network Block (GNB), as proposed
sity). From these teams, ATARI, Ramon Vallés, and STC
in [27]. A GNB contains three update functions and three
succeeded to advance to the Grand Finale, where teams
aggregation functions where the computation is done
from all the problem statements competed for winning from the edge to nodes, and then to global parameters.
the global challenge [25].
So irst, the edge’s features are updated and aggregated
into the node features, then the node features are updated
3.1 ATARI having taken into account the vicinity within depth/range
Wireless networks can be represented by graphs G=(V, E), de ined by the number of GNBs, and lastly, the global pa‑
where V is the set of nodes, i.e., STAs and APs, and E rep‑ rameters are updated according to the state of the nodes.
resent wireless links. Typically, DL approaches deal with Our model follows a layered approach, similar to DL,
graph‑structured data by processing the data into simpler where each layer is a GNB. The input of the model is a
structures, e.g., vectors. However, nodes and links in high‑ graph representing the deployment, and the output is the
density WLAN deployments are characterized by a set of predicted throughput of the devices in that deployment.
high‑dimensional features, thus complicating the graph‑ A general overview of our model’s architecture is shown
like structure of the problem and therefore hindering the in Fig. 4.
application of deep learning.
The implementation of the GNB is referenced as a meta‑
To overcome the problem of data representation, Graph layer in PyTorch Geometric [28], a geometric deep learn‑
Neural Networks (GNNs) have been proposed as neural ing extension library for PyTorch. We ined an edge
networks that operate on graphs intending to achieve re‑ model that uses two dense layers using a Recti ied Linear
lational reasoning and combinatorial generalization [26]. Unit (ReLU) as an activation function in a typical Multi‑
Accordingly, the wireless interactions between STAs and Layer Perceptron (MLP) iguration. A node model is
APs (connectivity, interference, among others) can be also de ined by two MLPs, one for aggregating the edge
easily captured via a graph representation. features into the node features and the second to update
© International Telecommunication Union, 2021 71