Page 126 - ITU Journal, ICT Discoveries, Volume 3, No. 1, June 2020 Special issue: The future of video and immersive media
P. 126

ITU Journal: ICT Discoveries, Vol. 3(1), June 2020


                                                              large for 27 comparisons (r > 0.5), medium to large in
             2.5
                                                              58 comparisons (0.3 < r ≤ 0.5), and small to medium in
              2                                               94 comparisons (0.1 < r ≤ 0.3). The largest effect size
                                                              observed (r = 0.63) corresponds to the difference between
             1.5
                                                              the U−090 / M+180 direction pair.
              1
                                                              Table 4 – Summary of significant differences spotted on pairwise
             0.5
                                                              comparisons of directional loudness sensitivities among source
                                                              directions.
              0
             -0.5                                                Directions  Very significant  Significant  Total
                                                                  (θ,φ)      (p < 0.01)   (p < 0.05)  differences
              -1                                                   ◦    ◦
                                                               (−45 ,−30 )       2           1         3
                                                                  ◦
                                                                       ◦
             -1.5                                               (0 ,−30 )        3           8         11
                  1  2  3  4  5  6  7  8  9  10  11  12           ◦    ◦
                                                                (45 ,−30 )       2           2         4
                                                                     ◦
                                                                       ◦
                                                                (−135 ,0 )       0           3         3
                                                                       ◦
                                                                    ◦
          Fig. 2 – Means and 95% confidence intervals of subject scores  (−90 ,0 )  3         3         6
                                                                       ◦
                                                                    ◦
          (DLS).                                                (−60 ,0 )        2           2         4
                                                                       ◦
                                                                    ◦
                                                                (−30 ,0 )        0           2         2
                                                                   ◦
                                                                     ◦
                                                                  (0 ,0 )        0           2         2
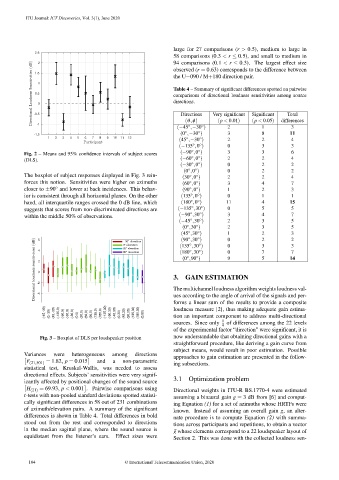
          The boxplot of subject responses displayed in Fig. 3 rein-  (30 ,0 )   2           2         4
                                                                      ◦
                                                                    ◦
          forces this notion. Sensitivities were higher on azimuths  (60 ,0 )    3           4         7
                                                                      ◦
                                                                    ◦
                     ◦
                                                                      ◦
                                                                    ◦
          closer to ±90 and lower at back incidences. This behav-  (90 ,0 )      1           2         3
                                                                      ◦
                                                                    ◦
          ior is consistent through all horizontal planes. On the other  (135 ,0 )  0        1         1
                                                                      ◦
                                                                    ◦
          hand, all interquartile ranges crossed the 0 dB line, which  (180 ,0 )  11         4         15
                                                                    ◦
                                                                        ◦
          suggests that scores from non-discriminated directions are  (−135 ,30 )  0         5         5
                                                                    ◦
                                                                       ◦
          within the middle 50% of observations.                (−90 ,30 )       3           4         7
                                                                    ◦
                                                                       ◦
                                                                (−45 ,30 )       2           3         5
                                                                   ◦
                                                                      ◦
                                                                 (0 ,30 )        2           3         5
                                                                      ◦
                                                                   ◦
                                                                 (45 ,30 )       1           2         3
                                                                   ◦  ◦
              6                                                  (90 ,30 )       0           2         2
                                                                       ◦
                                                                    ◦
                                                                (135 ,30 )       0           3         3
              4                                                     ◦  ◦
                                                                (180 ,30 )       0           7         7
                                                                      ◦
                                                                   ◦
                                                                 (0 ,90 )        9           5         14
              2
              0
                                                              3.  GAIN ESTIMATION
              -2
                                                              The multichannel loudness algorithm weights loudness val-
              -4
                                                              ues according to the angle of arrival of the signals and per-
                                                              forms a linear sum of the results to provide a composite
                 (-45,-30)  (0,-30)  (45,-30)  (-135,0)  (-90,0)  (-60,0)  (-30,0)  (0,0)  (30,0)  (60,0)  (90,0)  (135,0)  (180,0)  (-135,30)  (-90,30)  (-45,30)  (0,30)  (45,30)  (90,30)  (135,30)  (180,30)  (0,90)  loudness measure [2], thus making adequate gain estima-
                                                              tion an important component to address multi-directional
                                                              sources. Since only  1  of differences among the 22 levels
                                                                               4
                                                              of the experimental factor “direction” were significant, it is
               Fig. 3 – Boxplot of DLS per loudspeaker position  now understandable that obtaining directional gains with a
                                                              straightforward procedure, like deriving a gain curve from
                                                              subject means, would result in poor estimation. Possible
          Variances  were  heterogeneous  among  directions
                                                              approaches to gain estimation are presented in the follow-
          F (21,501)  = 1.82, p = 0.015  and  a  non-parametric  ing subsections.
          statistical test, Kruskal-Wallis, was needed to assess
          directional effects. Subjects’ sensitivities were very signif-
          icantly affected by positional changes of the sound source  3.1 Optimization problem

          H (21)  = 69.93, p < 0.001 . Pairwise comparisons using  Directional weights in ITU-R BS.1770-4 were estimated
         t-tests with non-pooled standard deviations spotted statisti-  assuming a binaural gain g = 3 dB from [6] and comput-
          cally significant differences in 58 out of 231 combinations  ing Equation (1) for a set of azimuths whose HRTFs were
          of azimuth/elevation pairs. A summary of the significant  known. Instead of assuming an overall gain g, an alter-
          differences is shown in Table 4. Total differences in bold  nate procedure is to compute Equation (2) with summa-
          stood out from the rest and corresponded to directions  tions across participants and repetitions, to obtain a vector
          in the median sagittal plane, where the sound source is  ~g whose elements correspond to a 22 loudspeaker layout of
          equidistant from the listener’s ears.  Effect sizes were  Section 2. This was done with the collected loudness sen-
           104                               © International Telecommunication Union, 2020
   121   122   123   124   125   126   127   128   129   130   131