
Page 125 - ITU Journal, ICT Discoveries, Volume 3, No. 1, June 2020 Special issue: The future of video and immersive media
P. 125
ITU Journal: ICT Discoveries, Vol. 3(1), June 2020
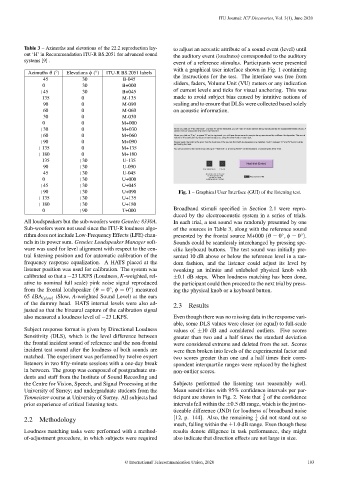
Table 3 – Azimuths and elevations of the 22.2 reproduction lay- to adjust an acoustic attribute of a sound event (level) until
out ‘H’ in Recommendation ITU-R BS.2051 for advanced sound the auditory event (loudness) corresponded to the auditory
systems [9] .
event of a reference stimulus. Participants were presented
with a graphical user interface shown in Fig. 1 containing
◦
◦
Azimuths θ ( ) Elevations φ ( ) ITU-R BS.2051 labels
the instructions for the test. The interface was free from
−45 −30 B-045
sliders, faders, Volume Unit (VU) meters or any indication
0 −30 B+000
+45 −30 B+045 of current levels and ticks for visual anchoring. This was
−135 0 M-135 made to avoid subject bias caused by intuitive notions of
−90 0 M-090 scaling and to ensure that DLSs were collected based solely
−60 0 M-060 on acoustic information.
−30 0 M-030
0 0 M+000
+30 0 M+030
+60 0 M+060
+90 0 M+090
+135 0 M+135
+180 0 M+180
−135 +30 U-135
−90 +30 U-090
−45 +30 U-045
0 +30 U+000
+45 +30 U+045
+90 +30 U+090 Fig. 1 – Graphical User Interface (GUI) of the listening test.
+135 +30 U+135
+180 +30 U+180
Broadband stimuli specified in Section 2.1 were repro-
0 +90 T+000
duced by the electroacoustic system in a series of trials.
All loudspeakers but the sub-woofers were Genelec 8330A. In each trial, a test sound was randomly presented by one
Sub-woofers were not used since the ITU-R loudness algo- of the sources in Table 3, along with the reference sound
◦
◦
rithm does not include Low-Frequency Effects (LFE) chan- presented by the frontal source M+000 (θ = 0 , φ = 0 ).
nels in its power sum. Genelec Loudspeaker Manager soft- Sounds could be seamlessly interchanged by pressing spe-
ware was used for level alignment with respect to the cen- cific keyboard buttons. The test sound was initially pre-
tral listening position and for automatic calibration of the sented 10 dB above or below the reference level in a ran-
frequency response equalization. A HATS placed at the dom fashion, and the listener could adjust its level by
listener position was used for calibration. The system was tweaking an infinite and unlabeled physical knob with
calibrated so that a −23 LKFS (Loudness, K-weighted, rel- ±0.1 dB steps. When loudness matching has been done,
ative to nominal full scale) pink noise signal reproduced the participant could then proceed to the next trial by press-
◦
◦
from the frontal loudspeaker (θ = 0 , φ = 0 ) measured ing the physical knob or a keyboard button.
65 dBA (slow) (Slow, A-weighted Sound Level) at the ears
of the dummy head. HATS internal levels were also ad- 2.3 Results
justed so that the binaural capture of the calibration signal
also measured a loudness level of −23 LKFS. Even though there was no missing data in the response vari-
able, some DLS values were closer (or equal) to full-scale
Subject response format is given by Directional Loudness values of ±10 dB and considered outliers. Five scores
Sensitivity (DLS), which is the level difference between greater than two and a half times the standard deviation
the frontal incident sound of reference and the non-frontal were considered extreme and deleted from the set. Scores
incident test sound after the loudness of both sounds are were then broken into levels of the experimental factor and
matched. The experiment was performed by twelve expert two scores greater than one and a half times their corre-
listeners in two fifty-minute sessions with a one-day break spondent interquartile ranges were replaced by the highest
in between. The group was composed of postgraduate stu- non-outlier scores.
dents and staff from the Institute of Sound Recording and
the Centre for Vision, Speech, and Signal Processing at the Subjects performed the listening test reasonably well.
University of Surrey; and undergraduate students from the Mean sensitivities with 95% confidence intervals per par-
3
Tonmeister course at University of Surrey. All subjects had ticipant are shown in Fig. 2. Note that of the confidence
4
prior experience of critical listening tests. intervals fell within the ±0.5 dB range, which is the just no-
ticeable difference (JND) for loudness of broadband noise
2.2 Methodology [12, p. 144]. Also, the remaining 1 4 did not stand out so
much, falling within the ±1.0 dB range. Even though these
Loudness matching tasks were performed with a method- results denote diligence in task performance, they might
of-adjustment procedure, in which subjects were required also indicate that direction effects are not large in size.
© International Telecommunication Union, 2020 103