
Page 222 - Kaleidoscope Academic Conference Proceedings 2020
P. 222
2020 ITU Kaleidoscope Academic Conference
Table 3 - Resultant table of example data stream
NORMAL MILD HIGH CRITICAL T 1 T 2 T 3 CLOSE FAR
H 1 4 2 1 3 0.9 1.0 0.6 4 1
H 2 4 2 1 3
H 3 4 2 1 3
H 4 4 2 1 3
H 5 4 2 1 3
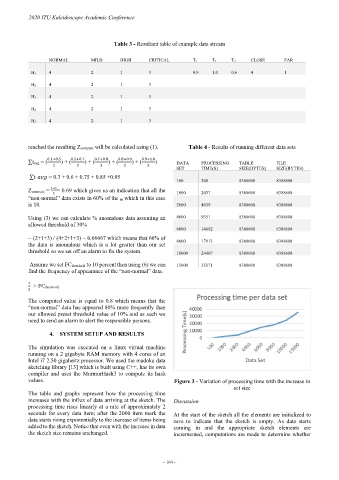
reached the resulting Zcompute will be calculated using (1). Table 4 - Results of running different data sets
∑tavg = ( 0.1+0.5 ) + ( 0.5+0.7 ) + ( 0.7+0.8 ) + ( 0.8+0.9 ) + ( 0.9+1.0 ) DATA PROCESSING TABLE FILE
2 2 2 2 2
SET TIME(S) SIZE(BYTES) SIZE(BYTES)
∑ = 0.3 + 0.6 + 0.75 + 0.85 +0.95
100 208 8388608 8388688
Zcompute = 3.45 = 0.69 which gives us an indication that all the 1000 2037 8388608 8388688
5
“non-normal” data exists in 60% of the m which in this case
is 10. 2000 4039 8388608 8388688
Using (3) we can calculate % anomalous data assuming an 4000 9351 8388608 8388688
allowed threshold of 30%
6000 14692 8388608 8388688
= (2+1+3) / (4+2+1+3) = 0.66667 which means that 66% of 8000 17913 8388608 8388688
the data is anomalous which is a lot greater than our set
threshold so we set off an alarm to fix the system. 10000 24407 8388608 8388688
Assume we set FCthreshold to 10 percent then using (6) we can 15000 35171 8388608 8388688
find the frequency of appearance of the “non-normal” data.
> FC threshold
4
5
The computed value is equal to 0.8 which means that the
“non-normal” data has appeared 80% more frequently than
our allowed preset threshold value of 10% and as such we
need to send an alarm to alert the responsible persons.
4. SYSTEM SETUP AND RESULTS
The simulation was executed on a linux virtual machine
running on a 2 gigabyte RAM memory with 4 cores of an
Intel i7 2.50 gigahertz processor. We used the madoka data
sketching library [13] which is built using C++, has its own
compiler and uses the MurmurHash3 to compute its hash
values. Figure 3 - Variation of processing time with the increase in
set size
The table and graphs represent how the processing time
increases with the influx of data arriving at the sketch. The Discussion
processing time rises linearly at a rate of approximately 2
seconds for every data item; after the 2000 item mark the At the start of the sketch all the elements are initialized to
data starts rising exponentially to the increase of items being zero to indicate that the sketch is empty. As data starts
added to the sketch. Notice that even with the increase in data coming in and the appropriate sketch elements are
the sketch size remains unchanged. incremented, computations are made to determine whether
– 164 –