
Page 221 - Kaleidoscope Academic Conference Proceedings 2020
P. 221
Industry-driven digital transformation
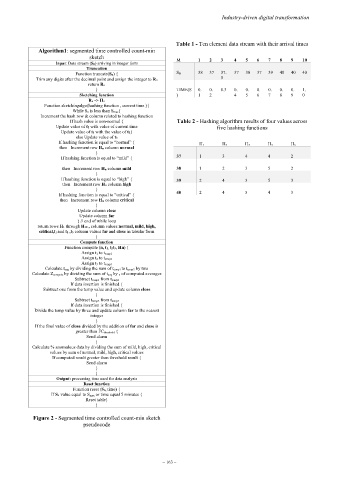
Table 1 - Ten element data stream with their arrival times
Algorithm1: segmented time controlled count-min
sketch M 1 2 3 4 5 6 7 8 9 10
Input: Data stream (Sn) arriving in integer form
Truncation
Function truncate(Sn) { S N 38 37 37. 37 38 37 39 40 40 40
Trim any digits after the decimal point and assign the integer to Rn 5
return Rn
} TIME(S 0. 0. 0.3 0. 0. 0. 0. 0. 0. 1.
Sketching function ) 1 2 4 5 6 7 8 9 0
Rn -> Hn
Function sketchingalgo(hashing function , current time ){
While S n is less than S max{
Increment the hash row & column related to hashing function
If hash value is non-normal { Table 2 - Hashing algorithm results of four values across
Update value of t2 with value of current time five hashing functions
Update value of t1 with the value of t2}
else Update value of t3
If hashing function is equal to “normal” { H 1 H 2 H 3 H 4 H 5
then Increment row Hn column normal
}
If hashing function is equal to “mild” { 37 1 3 4 4 2
then Increment row Hn column mild 38 1 2 3 5 2
}
If hashing function is equal to “high” { 39 2 4 3 5 3
then Increment row Hn column high
}
If hashing function is equal to “critical” { 40 2 4 5 4 3
then Increment row Hn column critical
}
Update column close
Update column far
} // end of while loop
return rows H1 through H10 , column values normal, mild, high,
critical,t1 and t2 ,t3 column values far and close in tabular form
}
Compute function
Function compute (n, t1, t2t3, Hn) {
Assign t 1 to t temp1
Assign t 2 to t temp2
Assign t 3 to t temp3
Calculate t avg by dividing the sum of t temp1 to t temp2 by two
Calculate Z compute by dividing the sum of t avg by n of computed averages
Subtract t temp1 from t temp2
If data insertion is finished {
Subtract one from the temp value and update column close
}
Subtract t temp2 from t temp3
If data insertion is finished {
Divide the temp value by three and update column far to the nearest
integer
}
If the final value of close divided by the addition of far and close is
greater than FC threshold {
Send alarm
}
Calculate % anomalous data by dividing the sum of mild, high, critical
values by sum of normal, mild, high, critical values
If computed result greater than threshold result {
Send alarm
}
}
Output: processing time used for data analysis
Reset function
Function reset (Sn, time) {
If Sn value equal to S max or time equal 5 minutes {
Reset table}
}
Figure 2 - Segmented time controlled count-min sketch
pseudocode
– 163 –