
Page 214 - Kaleidoscope Academic Conference Proceedings 2020
P. 214
2020 ITU Kaleidoscope Academic Conference
Action
label Wave Punch Kick Squat Sit Jump Run Walk Stand
Wave 6 0 1 1 0 0 1 0 343
Punch 0 0 0 1 0 0 0 237 5
Kick 15 4 6 3 0 0 296 0 2
Squat 0 0 0 0 0 279 0 0 0
Sit 0 0 0 0 562 0 1 0 0
Jump 39 5 23 246 0 0 3 0 6
Run 6 6 274 11 0 0 9 0 0
Walk 26 327 5 1 0 0 2 0 0
Stand 460 33 7 15 0 0 0 1 3
The F1 score is the measurement of a weighted harmonic
Figure 4 – System display of the recognized action mean of precision and recall normalized between 0 and 1 for
action of the action class on which the classifier is trained.
The F score of 1 indicates an ideal balance as precision and
therefore the recall are inversely related. A high F1 score is
beneficial where both high recall and precision is vital. The
Support is the number of actual occurrences of the class in
the test data set. Imbalanced support within the training data
may indicate the necessity for representative sampling or
rebalancing. The performance metrics for the action
classifier is shown in Table 2.
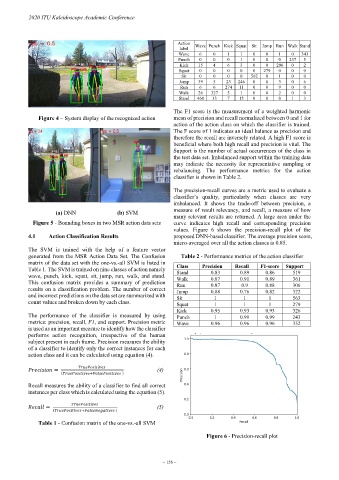
The precision-recall curves are a metric used to evaluate a
classifier’s quality, particularly when classes are very
imbalanced. It shows the trade-off between precision, a
(a) DNN (b) SVM measure of result relevancy, and recall, a measure of how
many relevant results are returned. A large area under the
Figure 5 - Bounding boxes in two MSR action data sets curve indicates high recall and corresponding precision
values. Figure 6 shows the precision-recall plot of the
4.1 Action Classification Results proposed DNN-based classifier. The average precision score,
micro-averaged over all the action classes is 0.85.
The SVM is trained with the help of a feature vector
generated from the MSR Action Data Set. The Confusion Table 2 - Performance metrics of the action classifier
matrix of the data set with the one-vs.-all SVM is listed in Class Precision Recall F1-score Support
Table 1. The SVM is trained on nine classes of action namely Stand 0.83 0.89 0.86 519
wave, punch, kick, squat, sit, jump, run, walk, and stand. Walk 0.87 0.91 0.89 361
This confusion matrix provides a summary of prediction Run 0.87 0.9 0.88 306
results on a classification problem. The number of correct Jump 0.88 0.76 0.82 322
and incorrect predictions on the data set are summarized with Sit 1 1 1 563
count values and broken down by each class. Squat 1 1 1 279
Kick 0.95 0.93 0.93 326
The performance of the classifier is measured by using Punch 1 0.99 0.99 243
metrics: precision, recall, F1, and support. Precision metric Wave 0.96 0.96 0.96 352
is used as an important measure to identify how the classifier
performs action recognition, irrespective of the human
subject present in each frame. Precision measures the ability
of a classifier to identify only the correct instances for each
action class and it can be calculated using equation (4).
= (4)
( + )
Recall measures the ability of a classifier to find all correct
instances per class which is calculated using the equation (5).
= (5)
( + )
Table 1 - Confusion matrix of the one-vs.-all SVM
Figure 6 - Precision-recall plot
– 156 –