
Page 26 - ITU Journal: Volume 2, No. 1 - Special issue - Propagation modelling for advanced future radio systems - Challenges for a congested radio spectrum
P. 26
ITU Journal: ICT Discoveries, Vol. 2(1), December 2019
3. DATA ANALYSIS of the noise contribution must yet be carefully
addressed due to CNR variations along the time;
The raw experimental data is loaded together and however, its contribution to the variance is small.
preprocessed by a dedicated tool to perform the
preprocessing [2]. This step aims to check the 4. RESULTS AND ANALYSIS
quality of the data and to derive the attenuation by
using the measured copolar levels and the The scintillation is usually characterized by the
estimated copolar levels that would be observed in distribution of the amplitude, (dB), or by the
the absence of attenuation. All preprocessed time standard deviation, , computed in 1-minute time
series are stored in a single daily file. windows. This last one is often calculated only for
For the scintillation analysis, first, the preprocessed dry periods, therefore, the periods with attenuation
data files are loaded and the scintillation time series larger than 0.5 dB at Ka-band and 1 dB at Q-band
is obtained by using a high pass filter, based on were excluded from the statistical calculations. The
raised cosine with a 0.025 Hz cut-off frequency. annual and monthly statistics here presented
Then, the wet refractivity, , is calculated using correspond to a full year, from June 2017 to
the temperature, T(ºC), relative humidity, H(%), May 2018.
and pressure, P(hPa), all integrated with a 10 4.1 Meteorological dependencies
minutes integration time, according to [3]:
The joint distributions of the hourly averaged
= 72 + 3.75 10 5 (1) scintillation standard deviation and meteorological
+273 ( +273) 2
parameters were calculated.
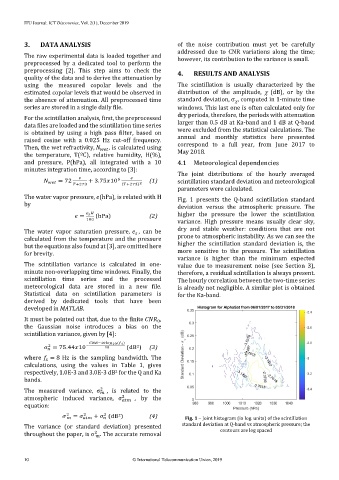
The water vapor pressure, (hPa), is related with H Fig. 1 presents the Q-band scintillation standard
by deviation versus the atmospheric pressure. The
= (hPa) (2) higher the pressure the lower the scintillation
100 variance. High pressure means usually clear sky,
The water vapor saturation pressure, , can be dry and stable weather: conditions that are not
calculated from the temperature and the pressure prone to atmospheric instability. As we can see the
but the equations also found at [3], are omitted here higher the scintillation standard deviation is, the
for brevity. more sensitive to the pressure. The scintillation
variance is higher than the minimum expected
The scintillation variance is calculated in one- value due to measurement noise (see Section 3),
minute non-overlapping time windows. Finally, the therefore, a residual scintillation is always present.
scintillation time series and the processed The hourly correlation between the two-time series
meteorological data are stored in a new file. is already not negligible. A similar plot is obtained
Statistical data on scintillation parameters is for the Ka-band.
derived by dedicated tools that have been
developed in MATLAB.
It must be pointed out that, due to the finite ,
0
the Gaussian noise introduces a bias on the
scintillation variance, given by [4]:
−10 10 ( )
2
= 75.44 10 − 10 (dB ) (3)
2
where = 8 Hz is the sampling bandwidth. The
calculations, using the values in Table 1, gives
respectively, 1.0E-3 and 3.0E-3 dB for the Q and Ka
2
bands.
The measured variance, σ 2 , is related to the
atmospheric induced variance, σ 2 , by the
equation:
= + (dB ) (4) Fig. 1 – Joint histogram (in log. units) of the scintillation
2
2
2
2
The variance (or standard deviation) presented standard deviation at Q-band vs atmospheric pressure; the
contours are log spaced
throughout the paper, is σ . The accurate removal
2
10 © International Telecommunication Union, 2019