
Page 21 - ITU Journal: Volume 2, No. 1 - Special issue - Propagation modelling for advanced future radio systems - Challenges for a congested radio spectrum
P. 21
ITU Journal: ICT Discoveries, Vol. 2(1), December 2019
6. DIFFERENT EFFECTS ON TIME of the plot. One can see that the power of the
TRANSFER RECEIVERS jamming signal changes with time, and is even shut
down sometimes during some periods. But the
It appeared that three different generations of time received power level is randomly changing, as can
transfer receivers from one single manufacturer be seen at the end of the period, where a peak power
were not reacting similarly to the GPS L1-band about 35 dB over the typical bottom power level is
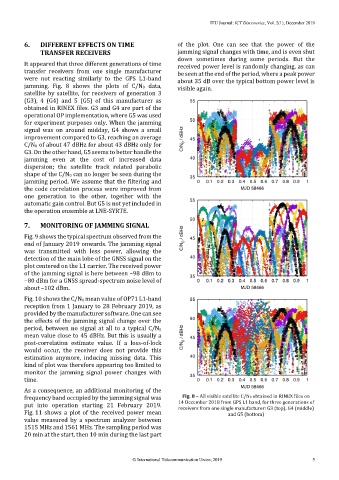
jamming. Fig. 8 shows the plots of C/N0 data, visible again.
satellite by satellite, for receivers of generation 3
(G3), 4 (G4) and 5 (G5) of this manufacturer as
obtained in RINEX files. G3 and G4 are part of the
operational OP implementation, where G5 was used
for experiment purposes only. When the jamming
signal was on around midday, G4 shows a small
improvement compared to G3, reaching an average
C/N0 of about 47 dBHz for about 43 dBHz only for
G3. On the other hand, G5 seems to better handle the
jamming even at the cost of increased data
dispersion; the satellite track related parabolic
shape of the C/N0 can no longer be seen during the
jamming period. We assume that the filtering and
the code correlation process were improved from
one generation to the other, together with the
automatic gain control. But G5 is not yet included in
the operation ensemble at LNE-SYRTE.
7. MONITORING OF JAMMING SIGNAL
Fig. 9 shows the typical spectrum observed from the
end of January 2019 onwards. The jamming signal
was transmitted with less power, allowing the
detection of the main lobe of the GNSS signal on the
plot centered on the L1 carrier. The received power
of the jamming signal is here between –98 dBm to
−80 dBm for a GNSS spread-spectrum noise level of
about –102 dBm.
Fig. 10 shows the C/N0 mean value of OP71 L1-band
reception from 1 January to 28 February 2019, as
provided by the manufacturer software. One can see
the effects of the jamming signal change over the
period, between no signal at all to a typical C/N0
mean value close to 45 dBHz. But this is usually a
post-correlation estimate value. If a loss-of-lock
would occur, the receiver does not provide this
estimation anymore, inducing missing data. This
kind of plot was therefore appearing too limited to
monitor the jamming signal power changes with
time.
As a consequence, an additional monitoring of the
frequency band occupied by the jamming signal was Fig. 8 – All visible satellite C/N0 obtained in RINEX files on
put into operation starting 21 February 2019. 14 December 2018 from GPS L1 band, for three generations of
receivers from one single manufacturer: G3 (top), G4 (middle)
Fig. 11 shows a plot of the received power mean and G5 (bottom)
value measured by a spectrum analyzer between
1515 MHz and 1561 MHz. The sampling period was
20 min at the start, then 10 min during the last part
© International Telecommunication Union, 2019 5