
Page 54 - ITU KALEIDOSCOPE, ATLANTA 2019
P. 54
2019 ITU Kaleidoscope Academic Conference
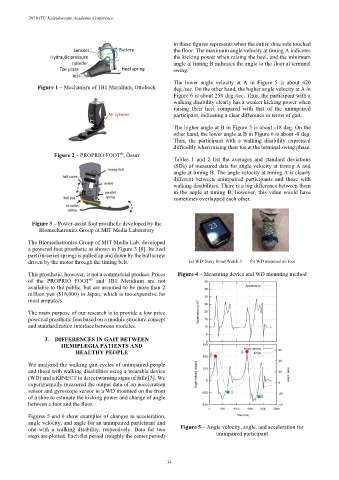
in these figures represents when the entire shoe sole touched
the floor. The maximum angle velocity at timing A indicates
the kicking power when raising the heel, and the minimum
angle at timing B indicates the angle to the floor at terminal
swing.
The lower angle velocity at A in Figure 5 is about 420
Figure 1 – Mechanism of 1B1 Meridium, Ottobock deg./sec. On the other hand, the higher angle velocity at A in
Figure 6 is about 250 deg./sec. Thus, the participant with a
walking disability clearly has a weaker kicking power when
raising their heel compared with that of the unimpaired
participant, indicating a clear difference in terms of gait.
The higher angle at B in Figure 5 is about -18 deg. On the
other hand, the lower angle at B in Figure 6 is about -8 deg.
Thus, the participant with a walking disability expressed
difficultly when raising their toe at the terminal swing phase.
Figure 2 – PROPRIO FOOT , Össur
®
Tables 1 and 2 list the averages and standard deviations
(SDs) of measured data for angle velocity at timing A and
angle at timing B. The angle velocity at timing A is clearly
different between unimpaired participants and those with
walking disabilities. There is a big difference between them
in the angle at timing B; however, this value would have
sometimes overlapped each other.
Figure 3 – Power-assist foot prosthetic developed by the
Biomechatronics Group of MIT Media Laboratory
The Biomechatronics Group of MIT Media Lab. developed
a powered foot prosthetic as shown in Figure 3 [8]. Its heel
part (in-series spring) is pulled up and down by the ball screw
driven by the motor through the timing belt. (a) WD: Sony SmartWatch 3 (b) WD mounted on foot
This prosthetic, however, is not a commercial product. Prices Figure 4 – Measuring device and WD mounting method
of the PROPRIO FOOT and 1B1 Meridium are not
®
available to the public, but are assumed to be more than 2
million yen ($18,000) in Japan, which is too expensive for
most amputees.
The main purpose of our research is to provide a low price
powered prosthetic foot based on a module structure concept
and standardization interface between modules.
3. DIFFERENCES IN GAIT BETWEEN
HEMIPLEGIA PATIENTS AND
HEALTHY PEOPLE
We analyzed the walking gait cycles of unimpaired people
and those with walking disabilities using a wearable device
(WD) and a KINECT to detect warning signs of falls [3]. We
experimentally measured the output data of an acceleration
sensor and gyroscope sensor in a WD mounted on the front
of a shoe to estimate the kicking power and change of angle
between a foot and the floor.
Figures 5 and 6 show examples of changes in acceleration,
angle velocity, and angle for an unimpaired participant and
one with a walking disability, respectively. Data for two Figure 5 – Angle velocity, angle, and acceleration for
steps are plotted. Each flat period (roughly the center period) unimpaired participant
– 34 –