
Page 102 - ITU KALEIDOSCOPE, ATLANTA 2019
P. 102
2019 ITU Kaleidoscope Academic Conference
Table 2 – The average execution time for each action in seconds and the percentage of improvement
Action A1 A2 A3 A4 A5 A6 A7 Avg. Improvement
Current 2.5 5.0 14.9 6.0 5.7 3.4 55.8
Desktop Proposed 1.7 3.4 14.5 4.3 3.6 3.3 40.2 32%
Improvement 47% 47% 3% 40% 58% 3% 39%
Current 3.0 5.5 12.9 7.0 13.1 11 69.8
Smartphone
Proposed 3.3 5.0 13.7 6.5 7.0 3.3 58 34%
Improvement -9% 10% -6% 8% 87% 233% 20%
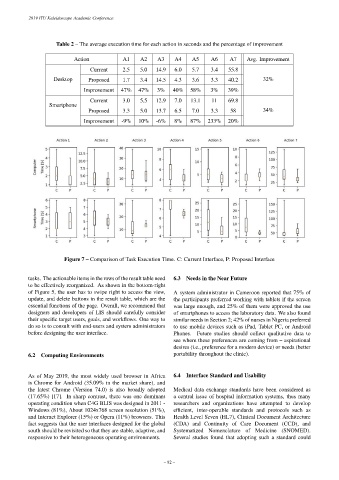
Figure 7 – Comparison of Task Execution Time. C: Current Interface, P: Proposed Interface
tasks. The actionable items in the rows of the result table need 6.3 Needs in the Near Future
to be effectively reorganized. As shown in the bottom-right
of Figure 5, the user has to swipe right to access the view, A system administrator in Cameroon reported that 75% of
update, and delete buttons in the result table, which are the the participants preferred working with tablets if the screen
essential functions of the page. Overall, we recommend that was large enough, and 25% of them were approved the use
designers and developers of LIS should carefully consider of smartphones to access the laboratory data. We also found
their specific target users, goals, and workflows. One way to similar needs in Section 2; 42% of nurses in Nigeria preferred
do so is to consult with end-users and system administrators to use mobile devices such as iPad, Tablet PC, or Android
before designing the user interface. Phones. Future studies should collect qualitative data to
see where these preferences are coming from – aspirational
desires (i.e., preference for a modern device) or needs (better
portability throughout the clinic).
6.2 Computing Environments
As of May 2019, the most widely used browser in Africa 6.4 Interface Standard and Usability
is Chrome for Android (35.09% in the market share), and
the latest Chrome (Version 74.0) is also broadly adopted Medical data exchange standards have been considered as
(17.65%) [17]. In sharp contrast, there was one dominant a central issue of hospital information systems, thus many
operating condition when C4G BLIS was designed in 2011 - researchers and organizations have attempted to develop
Windows (81%), About 1024x768 screen resolution (51%), efficient, inter-operable standards and protocols such as
and Internet Explorer (15%) or Opera (11%) browsers. This Health Level Seven (HL7), Clinical Document Architecture
fact suggests that the user interfaces designed for the global (CDA) and Continuity of Care Document (CCD), and
south should be revisited so that they are stable, adaptive, and Systematized Nomenclature of Medicine (SNOMED).
responsive to their heterogeneous operating environments. Several studies found that adopting such a standard could
– 82 –