
Page 57 - Proceedings of the 2018 ITU Kaleidoscope
P. 57
Machine learning for a 5G future
isolation. The different management areas, although can be used to visualize the whole profiling, anomaly
operating on different time scales and on different managed detection and diagnosis process.
objects, need to be able to share knowledge and make a
holistic picture of the whole system, for example: The collaborative self-healing with a QoE-driven backhaul
SON system was evaluated in a test network, where a ground
• Quality of Service (QoS) and Quality of truth could be established. Delay of different network
Experience (QoE) driven management: segments as well as radio KPIs such as the Channel Quality
Optimizing the end-to-end customer experience at Indicator (CQI) were monitored in both the anomaly
the application and individual subscriber level detection and diagnosis. The testbed consisted of two cells.
• Network Management (NM): Management
automation aggregated on a (Virtual) Network Test runs consisted of three-day cycles, where the first day
Function (V)NF level the network was in a normal state, the second a radio
• VNF and Service Orchestration: Orchestration of attenuation condition was present and on a third a Software
cloud resources, CPU cores, memory, storage, links Defined Network (SDN) misconfiguration was introduced in
etc. the radio backhaul network. The three-day cycle was
repeated four times, while constantly increasing background
To give an example, consider the corrective actions done by traffic (video streaming). When the background traffic
a QoE-driven self-healing function in a transport network volume was low, the self-healing mechanisms of the
SON system described in [11]. It can re-route traffic past backhaul SON solution could mitigate the problems caused
problematic links at a very fast pace. If there are underlying by the radio attenuation and the SDN misconfiguration so
issues necessitating such re-routing, however, which are not that the end user experience was not affected. However,
corrected, it may eventually happen that the QoE when the background traffic was increased, on the last three-
management system is no longer able to fulfill the customer day cycle the available resources become insufficient for the
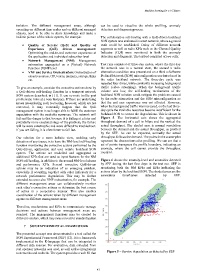
expectation with the available resources. The network will backhaul SON to correct the degradations. This is shown in
fail and the danger is that because it is failing at a later and Figure 5. The horizontal axis shows the aggregated
potentially more escalated stage of the problem, the failure throughput demand of a cell in Mbps and the vertical the
will be more catastrophic and more difficult to troubleshoot. actual throughput. The shaded area is normal correlation
If you are failing, it is often better to fail fast. between the demand and the actual throughput, as profiled
by the SEF. As can be expected, normally the actual
Our solution for a more holistic view, enabling early throughput follows the demand. The points in the scatter plot
detection of any issues, is to have the NM-level self-healing represent the observations after profiling. We can see that a
function monitoring the corrective actions performed by the set of points transgress the profile boundary, indicating an
QoE-driven, application and user centric backhaul SON anomaly, where the cell cannot provide the throughput
system. The actions are modelled and aggregated as required.
additional KPIs that are used as input features for the NM
SON self-healing, in addition to the normal NM-level alarms Figure 6 shows the anomaly-level and anomalies detected
and performance KPIs. Several corrective QoE-driven by SEF during the last four days in the test run. SEF is
actions may be an indication of an emerging problem, monitoring both the NM KPIs and KPIs indicating the
especially if occurring together with other indicators for a actions taken by the backhaul SON. The shaded areas are the
network performance degradation. This may be further anomalous timeframes detected by SEF.
extended to cover also VNF orchestration, for example. The
different management areas can collaboratively monitor
each other’s corrective actions or determine the best course
of action in a cooperative manner. This also enables
coordination of the actions taken by different management
agents on different management areas.
Therefore, mechanisms and KPIs to communicate manage
decisions and actions between management areas are
required. The management functions may be created by
different vendors, which may raise a need for standardization.
7 SON EXPERIMENTAL FRAMEWORK
The presented concept was demonstrated in a tool called the
SON Experimental Framework (SEF) [12]. It is a framework
implemented in the R-language that can be integrated to
different data sources. For evaluation, data collected from
real operator networks was used, as well as live integrations
to networks and testbeds. The system provides a web UI that Figure 5 – Service degradation as detected by SEF
– 41 –