
Page 53 - Proceedings of the 2018 ITU Kaleidoscope
P. 53
Machine learning for a 5G future
OSS contexts labeling
counters
augmented
learning
KPIs trend pattern root cause
profiles changes clusters analysis
anomaly anomaly anomaly
event
values patterns
detection
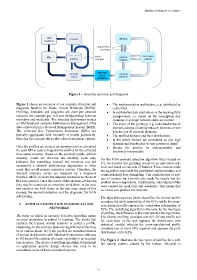
Figure 1 – Anomaly detection and diagnosis
Figure 1 shows an overview of our anomaly detection and • The implementation architecture, e.g. distributed or
diagnosis function for Radio Access Networks (RANs). centralized
Profiling, detection and diagnosis are done per selected • Is any labelled data available or is the learning fully
contexts, for example per cell and distinguishing between unsupervised, i.e. based on the assumption that
workdays and weekends. The intended deployment resides common or average network states are normal
on NM-level and analyzes Performance Management (PM) • The scope of the profiling: e.g. individual network
data collected from a Network Management System (NMS). element, subsets of similar network elements or one
The collected Key Performance Indicators (KPIs) are baseline for all network elements
typically aggregated with minutely or hourly granularity. • The profiled features and their distributions
Note that the concept allows also other deployment options. • Is the whole feature set considered as one high
dimensional distribution or only subsets of them?
Once the profiles are created, an anomaly level is calculated • Should the profiles be understandable and
for each KPI in each cell against the profiles for the collected intuitively interpretable
time series samples. Based on the anomaly levels, distinct
anomaly events are detected. An anomaly event only For the RAN anomaly detection algorithm that is based on
indicates that something unusual has occurred, but not [7], we decided that profiling would be on individual cell-
necessarily a network performance degradation or other level and based on sub-sets of features. These choices made
event that would require corrective actions. Therefore, the the algorithm applicable for distributed implementation and
detected anomaly events are analyzed by a diagnosis computationally less demanding. The consideration of sub-
function, which connects the detected anomalies to the most sets of features for a profile also made the results and the
like root cause(s). Once the causes of the anomaly are known, profiles more interpretable. Additionally, individual profiles
they may be connected to corrective workflows. In the next were created for work days and weekends. This means that
two sections we look closer at the two main steps of this we create two profiles for each cell.
process, the anomaly detection and the diagnosis, for RAN
self-healing.
The algorithm uses two kinds of profiles: the diurnal profile
considers the daily seasonality of the KPIs, while the cross-
4 ANOMALY DETECTION IN RADIO ACCESS correlational profile captures the correlation relationship of
NETWORKS KPIs. The underlying algorithm is the same for the two types
of profiles, the difference is the input data for the algorithms.
The basis on which an anomaly detection algorithm marks The diurnal profiling considers one KPI for one profile and
an event anomalous is subject to learning. The model that for each hour of the day captures the distribution with
captures the learned normal behavior is called a profile. statistical models, whereas the cross-correlational profile
Depending on the anomaly detection algorithm profiles may considers two or more KPIs together and captures the joint
be of various kinds: in [7] the profiles are statistical models distribution of the KPIs.
of normal distributions with fitted set of parameters, whereas
in [8] the profile consists of cluster centroids in an encoded The Figure 2 illustrates the two types of profiles for a cell:
feature space. The choice of profiling algorithm is dependent the diurnal pattern caused by the human life-cycle is
on application specific design choices that need to be
considered, some of these considerations are:
– 37 –