
Page 92 - Proceedings of the 2017 ITU Kaleidoscope
P. 92
2017 ITU Kaleidoscope Academic Conference
First of all, clustering is used to divide the output data of the
reduced model into different regions (clusters). Thus, the
user is able to select a cluster that represents desired process
results. After that, the classification trees are used to identify
regions of the parameters space (see also Table 1) which lead
to these process result.
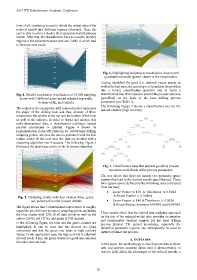
Fig. 6. Highlighting bad process results (blue cluster) and
good/desired results (green) cluster in the visualization
Having identified the good (i.e. desired) output spaces as
well as the bad ones, the next step is to transform the problem
into a binary classification problem and to build a
Fig. 4. Parallel coordinates visualization of 10,000 sampling classification tree that is used to predict the process outcome
points with 3 different axes (model outputs): top width, (good/bad) on the basis of the laser drilling process
bottom width, and conicity parameters (see Table 1).
The following Figure 7 shows a classification tree for the
The output of the asymptotic drill reduced model represents desired clusters (high conicity).
the shape of the drilling hole and thus consists of three
dimensions: the widths at the top and the bottom of the hole
as well as the conicity. In order to depict and analyze this
multi-dimensional data, a visualization technique named
parallel coordinates is utilized. Figure 4 shows its
implementation in the VPI platform for 10,000 laser drilling
sampling points, whereas the data is generated with the fast
reduce model. In the next step, the data are divided with a
clustering algorithm into 4 clusters. The following Figure 5
illustrates the clustering results of the K-means algorithm.
Fig. 7. Classification treee that predicts good/bad process
outcomes on the basis of the process parameters
The tree shows that there are mainly two parameter space
regions that lead to the desired results (good leaves). These
two regions can be defined by the following rules (extracted
from the tree):
≤ 170 & ℎ ≤ 0.0023
Fig. 5. Clustering results with four clusters (blue, green, & > 0.00064
red, yellow) of similar process outputs ≤ 140 & ℎ > 0.0026
& 0.00046 0.00064
The figure shows that 3-dimensional output space is roughly
separable into different groups of sampling points, including
the blue cluster with 22% of all data points as well as the These results show that the hybrid data analytics approach
on the top of the reduced model data provides an intuitive
yellow (26%), red (31%), and green (21%) clusters. and interpretable decision support for the laser drilling
In the following figure, the blue and the green clusters are process planner. The gained knowledge, especially the
highlighted. It can be seen that the clusters are lying identified parameter regions, can subsequently be used to
conversely and that the green one leads to high conicity further optimize the process.
values. In our application case, the high conicity is a desired
process result. Thus, the green cluster is a good one, whereas 6. OUTLOOK
the other ones are bad.
In this paper, the methodology to enrich sparse data to dense
data and analyze acquired dense data is demonstrated. In
order to fully utilize the advantages of the reduced models, a
– 76 –