
Page 43 - Proceedings of the 2017 ITU Kaleidoscope
P. 43
Challenges for a data-driven society
The case of Spain is analyzed further using Figure 13. Spain For countries to be successful in open data, they have to not
presents the highest change over the four years in the only have a good ICT development level but also a good
economic impact, although not having an equally high level of freedom and will of becoming more transparent.
entrepreneurs & business readiness. Moreover, as mentioned That is especially true for countries in the Middle East, which
other countries such as Italy and Ireland with higher could start already profiting from open data since they have
readiness do not achieve half of what Spain does. However, the ICT development and economical means yet do not seem
from observing Figure 11 it is not possible to determine the to have the interest. Opposite cases are countries in Latin
indicators causing this big impact. America like Mexico, that although being an upper middle-
income country it seems to invest in open data to improve
4.2. Development of economic impact scores from 2013 to the transparency. There are indications that countries with
2016 low ICT development (ICT access, ICT use, and ICT skills)
do not profit from open data, but the evidence is limited, due
In this part, the analysis is on the changes in the to the small number of countries observed. The current status
entrepreneurs & business readiness and the economic shows that there is a correlation between entrepreneurs &
impact. As can be seen in Figure 12, it is not possible to business readiness and economic impact. However, it is not
conclude that changes in implementation and readiness possible to see that changes in entrepreneurs & business
during the time of the study has led to changes in the readiness during the time of the study have an obvious
economic impact, as there is no obvious relationship between relationship with changes in the economic impact. To
the change in the sub-indexes and the overall economic measure innovation is very difficult. When replacing the
impact measure. From this observation, one could draw three ODB impact score with an independent measure, the new
possible conclusions. The first is that the time of four years business density per country, a more complex relationship is
is not long enough time to actually notice a direct influence observed. As can be expected this high level measure is
on the economic impact through these measures, the second influenced by many other factors. There is wide room for
is that the measures themselves have been ineffective, and further research in this area.
the third that the fact that countries started from very Further study should investigate whether the time frame of
different levels has been more important to what they have four years too short to notice influence on the economic
done during these four years than the recent development, impact through these measures, the measures themselves
especially for those countries that started at the top of the have been ineffective, or different starting levels have been
rank back in 2013. more important in further development than actual changes
during the four years of observation.
REFERENCES
[1] A. Abellá-García, M. Ortiz-De-Urbina-Criado, and C. De-
Pablos-Heredero, “The Ecosystem of Services Around Smart
Cities: An Exploratory Analysis,” presented at the Procedia
Computer Science, vol. 64, pp. 1075–1080, 2015.
[2] A. Ojo, E. Curry, and F. A. Zeleti, “A tale of open data
innovations in five smart cities,” presented at the Proceedings
of the Annual Hawaii International Conference on System
Sciences, pp. 2326–2335, 2015.
[3] C. Shen, Z. Riaz, M. S. Palle, Q. Jin, and F. Peña-Mora “Open
Data Landscape: A Global Perspective and a Focus on China”
In: Janssen M. et al. (eds) Open and Big Data Management and
Innovation. Lecture Notes in Computer Science, vol 9373.
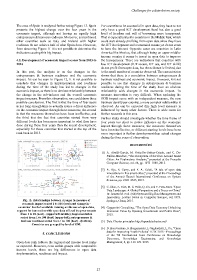
Fig. 12. Relationships between changes in measure of Springer, Cham, 2015.
economic impact scaled 1 to 100 (best) and change in -
countries´ level of available training on the use of open data, [4] Capgemini Consulting, “The Open Data Economy Unlocking
support for innovation with open data offered by governments Economic Value by Opening Government and Public Data”,
from 1 to 10 (best) - (upper left-middle); implementation 2013.
scaled from 1 to 100 (best) (upper-left); entrepreneurs &
business readiness scaled from 1 to 100 (best) - (bottom). [5] Data Charter principles http://opendatacharter.net/
Countries are grouped by level of GNI.
[6] D. Beneventano, S. Bergamaschi, L Gagliardelli, L. Po, “Open
data for improving Youth Policies” IC3K 2015 - Proceedings
5. CONCLUSIONS of the 7th International Joint Conference on Knowledge
Discovery, Knowledge Engineering and Knowledge
Open data rank follows the regional and income level ranks Management, 2, pp. 118-129. 2015.
as expected. However, even within groups with comparable
income levels, there are big differences in open data
implementation, readiness and impact.
– 27 –