
Page 38 - Proceedings of the 2017 ITU Kaleidoscope
P. 38
2017 ITU Kaleidoscope Academic Conference
early this summer allows making the first observations of the In contrast to other benchmarks, such as GODI, that focuses
global open data development trends such as the one on datasets, the ODB contains indicators for both inputs and
presented in this paper. outputs of open data. It is unique in the way that it also
Studies on open data have been focused on open data provides indexes for the impact, and supporting factors.
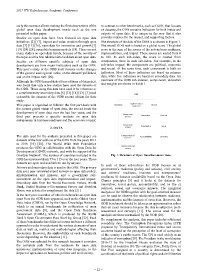
initiatives [2] [17], impact and value creation through open The structure of the data of the ODB is as shown in Figure 1.
data [7] [15] [16], open data for innovation and growth [1] The overall ODB rank is based on a global score. The global
[19] [24] [28], open data business models [18]. There are not score is the sum of the scores of the sub-indexes readiness,
many studies on open data trends, because of the novelty of implementation, and impact. These scores are scaled from 0
the topic and the few reliable historical data about open data. to 100. In each sub-index, the score is created from
Studies on different specific subjects of open data components, three in each sub-index. For example, in the
development are from major institutions such as the ODB. sub-index impact, the components are political, economic
This year´s study of the ODB itself focuses on the changes and social. At the same time, each component is built on
of the general and regional ranks, on the datasets published, indicators. Most of these indicators are based on primary
and on the impact rank [20]. data, while five indicators are based on secondary data. An
Although the ODB has published four editions of datasets, it overview of the ODB sub-indexes, components, indicators
was found that only a few studies have used the datasets of and weights are shown in Table 1.
the ODB. Those using this data have used it for reference or
a complementary secondary data [6] [13] [14] [23]. [3] used
extensible the datasets of the ODB second edition for their
study.
This paper is organized as follows: the first part deals with
the current global status of open data, the second treats the
development of open data over the last four years, and the
third part presents a specific analysis on open data
entrepreneur & business readiness and the economic impact.
2. DATA
The data used for the analysis presented in this paper are
datasets of the four editions of the ODB from the years 2013
to 2016 [10] [20]. The World Wide Web Foundation
produces the ODB in collaboration with the Open Data for
Development (OD4D) network, and with the support of the
Omidyar Network. The number of countries included in the Fig. 1. Structure of Open Data Barometer data.
ODB has increased from 77 to 115 over the four years. These
datasets are open and available to use by anyone. In each of these sub-indexes the ODB focuses on a)
Primary and secondary data is used in the ODB. The primary government´s readiness (policy and actions), civil society
data are a peer-reviewed expert surveys on open data policy, and citizens´ readiness, business and entrepreneurs’
implementation and impacts, and a government self- readiness; b) datasets availability based on the Open Data
assessment on the open data implementation and impact. Charter principles [5] and it looks at the datasets for
Secondary data from the World Economic Forum, World innovation, social policy, accountability; and on the c)
Bank, United Nations e-Government Survey and Freedom political, social, and economic impacts. The insightful
House was selected to complement the data [21]. analysis of the ODB together with the goal-oriented measure
In the last years a number of other benchmarks on open data can be used to observe the relationship between readiness,
apart from the ODB have appeared, such as the Global Open implementation and the impacts of open data. However, the
Data Index (GODI), run by the Open Knowledge Network, ODB benchmark should be taken as an approximation rather
which is an annual benchmark for publication of open than on exact measures because the data is subjective (self-
government data [9]; and the Open Data Readiness assessment and surveys) [11]. The scores used for the
Assessment (ODRA), which is produced by the World analysis are those normalized by the ODB [20].
Bank´s Open Government Data Working Group [22]. Each To complement the analysis, this paper includes additional
of these benchmarks has different scopes and uses a different secondary data. The Corruption Perceptions Index (CPI)
approach in order to understand the various elements of open prepared by Transparency International ranks and scores
data as well as, metrics and methodologies affecting their countries based on the perception of the level of corruption
fluctuation. However, the applicability of each benchmark of the country´s public sector. The CPI is used widely as an
varies depending on the situation [11]. indicator of corruption [29]. The Freedom in the world status
The ODB was selected for this research because it considers 2016-17 by the Freedom House evaluates the state of
the complete path from the readiness for open data freedom of countries [8]. The category Free, Partly Free, or
initiatives; implementation of open data programs, to the Not Free assigned to a country is determined by the
impact of open data on business, politics and civil society. combination of the levels of political rights and civil liberties
– 22 –