
Page 128 - Proceedings of the 2017 ITU Kaleidoscope
P. 128
2017 ITU Kaleidoscope Academic Conference
(3) Sleeping hours 9. SUCCESS IN STUDENT’S HEALTH CONCIOUSNESS
The implemented system applied to several students as
collaborators in this study. One collaborator has been wearing
Fitbit since summer 2016 and has started to monitor weights and
Body Mass Index (BMI) by himself. BMI is defined by weight
in kilograms divided by square of height in meters to show the
degree of obesity. Below 25 is normal while the obesity degree
1 if below 30 and the degree 2 below 35. Collaborator efforts
along with the author’s advice based upon shared data within the
system has proven to be a success in twelve weeks. Collaborator
BMI became 28.15 in the obesity degree 1 from 30.6 in degree 2
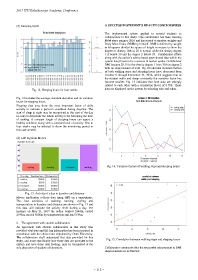
with an improvement of 2.48. Fig.14 indicates variation factors
of both walking steps and sleeping hours have decreased from
October 9 through December 31, 2016, which suggests that as
the student walks and sleeps constantly the variation factor has
become smaller. Fig. 15 indicates that both data are strongly
related to each other with a correlation factor of 0.708. Those
Fig. 12. Sleeping hours for four weeks data are displayed on the system by selecting who and when.
Fig. 12 includes the average, standard deviation and its variation
factor for sleeping hours.
Sleeping data may show the most important factor of daily
activity to indicate a person’s condition during daytime. The
start of sleep at night may be recognized as the start of the day
in order to determine the whole activity level following the time
of waking. A constant length of sleeping hours can assure a
healthy condition along with a constant level of activity. One to
four weeks may be selected to show the monitoring period in
this case as well.
(4) Life log from Moves
Fig. 14. Variation factors of walking steps and sleeping hours
Fig. 13. Activity of a day in duration and distance
Moves application collects data using GPS on a smartphone.
The four activities of walking, running, cycling and
transportation in duration and distance are shown in Fig. 13 and
this data will indicate the activity level during a day. For
instance on May 21, 2017 the author walked 3344m, cycled
2793m, moved 3806m by transportation and ran 5739m.
2. The agreement with student collaborators
An agreement with student collaborators in this study who
provided vital data and life log information has been prepared in
accordance with the ethics rules stipulated by Otani University.
The collaborators shall understand that data provided for this
study, and more specifically how those data are provided to the Fig. 15. Correlation between walking steps and sleeping hours
system and how those data feeding, may be terminated at the
sole discretion of student collaborators. Collaborator comments after the successful achievement in BMI
improvements are as follows:
– 112 –