
Page 127 - Proceedings of the 2017 ITU Kaleidoscope
P. 127
Challenges for a data-driven society
monitor eye focus or drowsiness. In analyzing each student’s
total data from wristband wearable device Fitbit and eyeglasses
JINS MEME, a student’s behaviors can be more clearly
modeled for the purpose of a more productive educational
system on campus.
1. Data from Fitbit and Moves
The system allows selection one member of a formed group
with any date of the past records concerning heart rate, walking
steps, sleeping hours and life log.
Fitbit allows the monitoring of such vital data as heart rate,
walking steps, walking distance and consumed calories. Once
synchronized between Fitbit on a wrist and smartphone, data are
reflected via application on smartphone and data are forwarded
to a cloud storage that can interface with the RStudio’s Shiny
server.
Moves, an application on smartphone allows the monitoring of
life log such as what activities are deployed such as walking,
running, cycling and transportation. Locations and travelling
routes can also be monitored on a map but such data are Fig. 10. Heart rates and activity labeling of a day
excluded from this system because of privacy issues.
(1) Records on heart rate and activity record (2) Walking steps
Heart rate is recorded every five minutes. An example of heart
rate in a day is shown in Fig.10. A vertical red line shows the
increase in beats by five or more and a vertical blue line shows
the decrease in heart rate by five or more by default. Walking or
other activities are accompanied by higher rates while sleeping
or other passive activities lower beats. Data from Moves on
walking, running, cycling or transportation explains why Fitbit
can sense heart rate change. The combination of two data, one
from Fitbit and one from Moves, to one screen allows labeling
action for changes of heart rate.
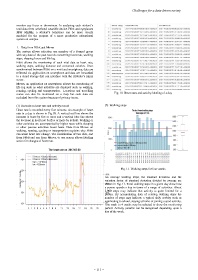
Fig. 11. Walking steps for four weeks
An average walking steps, the standard deviation and the
variation factor of standard deviation divided by average are
shown in Fig. 11. Total walking steps in a given day show how
a person spends a day in terms of a range of activities. About
2,000 steps may indicate that activity is quite limited for a
person. By accumulating data of relating walking steps the
number of steps may indicate a typical daily activity such as
commuting to school, staying at home or joining a sport activity.
One week to 4 weeks may be selected to show the monitoring
period. Activity patterns can be recognized depending upon a
day of the week.
– 111 –