
Page 14 - ITU Indicators for Smart Sustainable Cities – Pilot project Singapore
P. 14
ITU Indicators for Smart Sustainable Cities – Pilot project Singapore
Sub- Singapore
Dimension Indicator KPI definition
dimension Reported Value
2 Maximum 24-hour, 8-hour or 1-hour
3 99th percentile
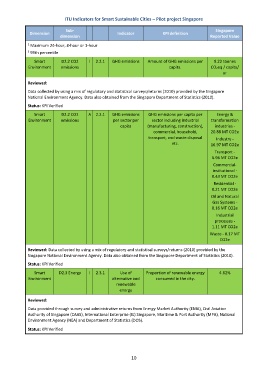
Smart D2.2 CO2 I 2.2.1 GHG emissions Amount of GHG emissions per 9.22 tonnes
Environment emissions capita. CO2eq / capita/
yr
Reviewed:
Data collected by using a mix of regulatory and statistical surveys/returns (2010) provided by the Singapore
National Environment Agency. Data also obtained from the Singapore Department of Statistics (2010).
Status: KPI Verified
Smart D2.2 CO2 A 2.2.1 GHG emissions GHG emissions per capita per Energy &
Environment emissions per sector per sector including industrial transformation
capita (manufacturing, construction), industries -
commercial, household, 20.88 MT CO2e
transport, and waste disposal Industry -
etc. 16.97 MT CO2e
Transport -
6.96 MT CO2e
Commercial-
institutional -
0.43 MT CO2e
Residential -
0.21 MT CO2e
Oil and Natural
Gas Systems -
0.16 MT CO2e
Industrial
processes -
1.11 MT CO2e
Waste - 0.17 MT
CO2e
Reviewed: Data collected by using a mix of regulatory and statistical surveys/returns (2010) provided by the
Singapore National Environment Agency. Data also obtained from the Singapore Department of Statistics (2010).
Status: KPI Verified
Smart D2.3 Energy I 2.3.1 Use of Proportion of renewable energy 4.62%
Environment alternative and consumed in the city.
renewable
energy
Reviewed:
Data provided through survey and administrative returns from Energy Market Authority (EMA), Civil Aviation
Authority of Singapore (CAAS), International Enterprise (IE) Singapore, Maritime & Port Authority (MPA), National
Environment Agency (NEA) and Department of Statistics (DOS).
Status: KPI Verified
10