
Page 17 - ITU Indicators for Smart Sustainable Cities – Pilot project Singapore
P. 17
ITU Indicators for Smart Sustainable Cities – Pilot project Singapore
Sub- Singapore
Dimension Indicator KPI definition
dimension Reported Value
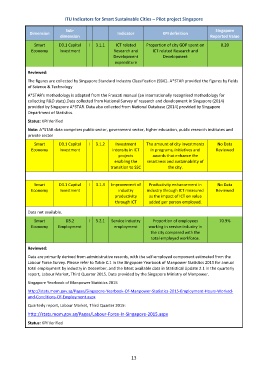
Smart D3.1 Capital I 3.1.1 ICT related Proportion of city GDP spent on 0.20
Economy Investment Research and ICT related Research and
Development Development
expenditure
Reviewed:
The figures are collected by Singapore Standard Industry Classification (SSIC). A*STAR provided the figures by fields
of Science & Technology
A*STAR’s methodology is adapted from the Frascati manual (an internationally recognised methodology for
collecting R&D stats).Data collected from National Survey of research and development in Singapore (2014)
provided by Singapore A*STAR. Data also collected from National Database (2014) provided by Singapore
Department of Statistics.
Status: KPI Verified
Note: A*STAR data comprises public sector, government sector, higher education, public research institutes and
private sector
Smart D3.1 Capital I 3.1.2 Investment The amount of city investments No Data
Economy Investment intensity in ICT in programs, initiatives and Reviewed
projects awards that enhance the
enabling the smartness and sustainability of
transition to SSC the city.
Smart D3.1 Capital I 3.1.3 Improvement of Productivity enhancement in No Data
Economy Investment industry industry through ICT measured Reviewed
productivity as the impact of ICT on value
through ICT added per person employed.
Data not available.
Smart D3.2 I 3.2.1 Service industry Proportion of employees 70.9%
Economy Employment employment working in service industry in
the city compared with the
total employed workforce.
Reviewed:
Data are primarily derived from administrative records, with the self-employed component estimated from the
Labour Force Survey. Please refer to Table C.1 in the Singapore Yearbook of Manpower Statistics 2015 for annual
total employment by industry in December, and the latest available data in Statistical Update 2.1 in the quarterly
report, Labour Market, Third Quarter 2015. Data provided by the Singapore Ministry of Manpower.
Singapore Yearbook of Manpower Statistics 2015
http://stats.mom.gov.sg/Pages/Singapore-Yearbook-Of-Manpower-Statistics-2015-Employment-Hours-Worked-
and-Conditions-Of-Employment.aspx
Quarterly report, Labour Market, Third Quarter 2015:
http://stats.mom.gov.sg/Pages/Labour-Force-In-Singapore-2015.aspx
Status: KPI Verified
13