
Page 16 - ITU Indicators for Smart Sustainable Cities – Pilot project Singapore
P. 16
ITU Indicators for Smart Sustainable Cities – Pilot project Singapore
Sub- Singapore
Dimension Indicator KPI definition
dimension Reported Value
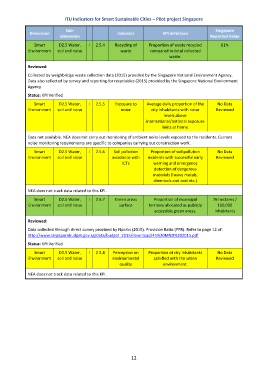
Smart D2.5 Water, I 2.5.4 Recycling of Proportion of waste recycled 61%
Environment soil and noise waste compared to total collected
waste.
Reviewed:
Collected by weighbridge waste collection data (2015) provided by the Singapore National Environment Agency.
Data also collected by survey and reporting for recyclables (2015) provided by the Singapore National Environment
Agency.
Status: KPI Verified
Smart D2.5 Water, I 2.5.5 Exposure to Average daily proportion of the No Data
Environment soil and noise noise city inhabitants with noise Reviewed
levels above
international/national exposure
limits at home.
Data not available. NEA does not carry out monitoring of ambient noise levels exposed to the residents. Current
noise monitoring requirements are specific to companies carrying out construction work.
Smart D2.5 Water, I 2.5.6 Soil pollution Proportion of soil pollution No Data
Environment soil and noise avoidance with incidents with successful early Reviewed
ICTs warning and emergency
detection of dangerous
materials (heavy metals,
chemicals and acid etc.)
NEA does not track data related to this KPI.
Smart D2.5 Water, I 2.5.7 Green areas Proportion of municipal 76 hectares /
Environment soil and noise surface territory allocated as publicly 100,000
accessible green areas. inhabitants
Reviewed:
Data collected through direct survey provided by Nparks (2015). Provision Ratio (PPR). Refer to page 12 of:
http://www.singaporebudget.gov.sg/data/budget_2015/download/45%20MND%202015.pdf
Status: KPI Verified
Smart D2.5 Water, I 2.5.8 Perception on Proportion of city inhabitants No Data
Environment soil and noise environmental satisfied with the urban Reviewed
quality environment.
NEA does not track data related to this KPI.
12