
Page 916 - Shaping smarter and more sustainable cities - Striving for sustainable development goals
P. 916
Annex R
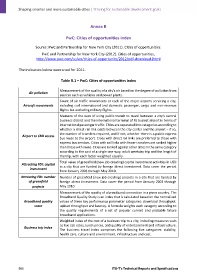
PwC: Cities of opportunities index
Source: PwC and Partnership for New York City (2011). Cities of opportunities.
PwC and Partnership for New York City (2012). Cities of opportunities,
http://www.pwc.com/us/en/cities‐of‐opportunity/2012/pdf‐download.jhtml
The indicators below were used for 2011.
Table R.1 – PwC: Cities of opportunities index
Measurement of the quality of a city's air based on the degree of pollution from
Air pollution
sources such as vehicles and power plants.
Count of air traffic movements at each of the major airports servicing a city,
Aircraft movements including civil international and domestic passenger, cargo and non‐revenue
flights but excluding military flights.
Measure of the ease of using public transit to travel between a city's central
business district and the international terminal of its busiest airport in terms of
international passenger traffic. Cities are separated into categories according to
whether a direct rail link exists between the city center and the airport – if so,
the number of transfers required, and if not, whether there is a public express
Airport to CBD access
bus route to the airport. Cities with direct rail links are preferred to those with
express bus services. Cities with rail links with fewer transfers are ranked higher
than those with more. Cities are ranked against other cities in the same category
according to the cost of a single one‐way, adult weekday trip and the length of
the trip, with each factor weighted equally.
Total value of greenfield (new job‐creating) capital investment activities in USD
Attracting FDI: capital
in a city that are funded by foreign direct investment. Data cover the period
investment
from January 2003 through May 2010.
Attracting FDI: number Number of greenfield (new job‐creating) projects in a city that are funded by
of greenfield foreign direct investment. Data cover the period from January 2003 through
projects May 2010.
Measurement of the quality of a broadband connection in a given country. The
Broadband Quality Study is an index that is calculated based on the normalized
Broadband quality values of three key performance parameter categories: download throughput,
score upload throughput and latency. A formula weights each category according to
the quality requirements of a set of popular current and probable future
broadband applications.
Weighted index of the cost of a business trip to a city, including measures such
as taxi cab rates, lunch prices, and quality of entertainment and infrastructure.
Business trip index
The business travel index comprises the following five categories: stability,
health care, culture and environment, infrastructure and cost.
906 ITU‐T's Technical Reports and Specifications