Page 913 - Shaping smarter and more sustainable cities - Striving for sustainable development goals
P. 913

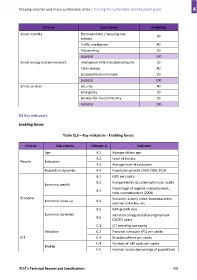
Criteria                           Sub‐criteria                  weighting
             Smart mobility                       Electromobility ( including low               40
                                                  carbon)
                                                  Traffic intelligence                          40
                                                  Teleworking                                   20

                                                  Subtotal                                     100
             Smart energy and environment         Intelligence of distribution networks         30
                                                  Clean energy                                  40
                                                  Sustainable environment                       30

                                                  Subtotal                                     100
             Smart services                       Security                                      40
                                                  Emergency                                     30
                                                  Services for the community                    30
                                                  Subtotal                                     100


            D3 Key indicators

            Enabling forces


                                       Table Q.5 – Key indicators ‐ Enabling forces

                Criteria           Sub‐criteria         Indicator #                 Indicator

                            Age                            A.1       Average citizen age
                                                           A.2       Level of literacy
             People         Education
                                                           A.3       Average level of education

                            Population dynamics            A.4       Population growth CAGR 2005‐2010
                                                           B.1       GDP per capita
                                                           B.2       Energy/electricity consumption per capita
                            Economic wealth
                                                                     Percentage of register unemployment,
                                                           B.3
                                                                     total unemployment (2009)
             Economy                                                 Economic activity index, industrial index,
                            Economic make‐up               B.4
                                                                     commercial index, etc.
                                                           B.5       GDP growth rate
                            Economic dynamics                        Variation of registered unemployment
                                                           B.6
                                                                     CAGR 5 years
                                                           C.1       ICT spending per capita
                            Adoption                       C.2       Personal computer (PC) per capita

             ICT                                           C.3       Broadband lines per capita
                                                           C.4       Number of SIM cards per capita
                            Mobile
                                                           C.5       Internet access (percentage of population)


            ITU‐T's Technical Reports and Specifications                                                  903
   908   909   910   911   912   913   914   915   916   917   918