
Page 915 - Shaping smarter and more sustainable cities - Striving for sustainable development goals
P. 915
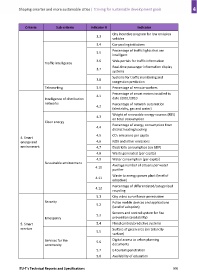
Criteria           Sub‐criteria         Indicator #                 Indicator
                                                                     City incentive program for low emission
                                                           3.3
                                                                     vehicles
                                                           3.4       Car‐pooling initiatives
                                                                     Percentage of traffic lights that are
                                                           3.5
                                                                     intelligent
                                                           3.6       Web‐portals for traffic information
                            Traffic intelligence
                                                                     Real‐time passenger information display
                                                           3.7
                                                                     systems
                                                                     Systems for traffic monitoring and
                                                           3.8
                                                                     congestion prediction
                            Teleworking                    3.9       Percentage of remote workers

                                                                     Percentage of smart meters installed to
                                                           4.1
                            Intelligence of distribution             date /2011/2010
                            networks                                 Percentage of network automation
                                                           4.2
                                                                     (electricity, gas and water)
                                                                     Weight of renewable energy sources (RES)
                                                           4.3
                                                                     on total consumption
                            Clean energy
                                                                     Percentage of energy consumption from
                                                           4.4
                                                                     district heating/cooling
                                                           4.5       CO2 emissions per capita
             4. Smart
             energy and                                    4.6       NOX and other emissions
             environment                                   4.7       Electricity consumption (on GDP)

                                                           4.8       Waste generated (per capita)
                                                           4.9       Water consumption (per capita)
                            Sustainable environment
                                                                     Average number of citizens per water
                                                           4.10
                                                                     purifier
                                                                     Waste to energy power plant (level of
                                                           4.11
                                                                     adoption)
                                                                     Percentage of differentiated/categorized
                                                           4.12
                                                                     recycling
                                                           5.1       City video surveillance penetration
                            Security                                 Police mobile devices and applications
                                                           5.2
                                                                     (level of adoption)
                                                                     Sensors and control system for fire
                                                           5.3
                            Emergency                                prevention (availability)

             5. Smart                                      5.4       Flood control/predictive systems
             services                                                Surface of green area (on total city
                                                           5.5
                                                                     surface)

                            Services for the                         Digital access to urban planning
                                                           5.6
                            community                                documents
                                                           5.7       E‐tourism penetration

                                                           5.8       Availability of education


            ITU‐T's Technical Reports and Specifications                                                  905