Page 70 - Shaping smarter and more sustainable cities - Striving for sustainable development goals
P. 70

Total                 %
                No                      Keyword                        Occurrences           Occurrence
                25     Urban                                                16                  2.2%
                26     Society                                               6                  0.8%
                27     Actively                                              4                  0.6%
                28     Innovation                                           15                  2.1%
                29     Aware                                                 2                  0.3%
                30     Participatory                                         3                  0.4%
                31     Efficient                                            24                  3.3%
                32     Sustainable                                          28                  3.9%
                33     Adaptable                                             3                  0.4%
                34     Optimal                                               2                  0.3%
                35     Environment                                          22                  3.0%
                36     Resources                                            27                  3.7%

                37     Natural                                              11                  1.5%
                38     Governance and administration                        35                  4.8%
                39     Management                                           20                  2.8%
                40     Capital                                               4                  0.6%
                41     Operational                                           1                  0.1%
                42     Public                                                6                  0.8%
                43     Solutions                                             4                  0.6%
                44     Vision                                                1                  0.1%
                45     Economy                                              34                  4.7%
                46     Investments                                           9                  1.2%
                47     Business                                             13                  1.8%
                48     Competitive                                           5                  0.7%
                49     Mobility                                             14                  1.9%
                50     Transport                                            18                  2.5%
                                     Total                                 726                  100%

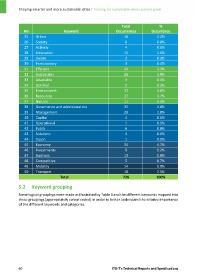
            5.2  Keyword grouping

            Some logical groupings were made as illustrated by Table 3 and the different keywords mapped into
            these groupings (appropriately colour coded) in order to better understand the relative importance
            of the different keywords and categories.


            60                                                       ITU‐T's Technical Reports and Specifications
   65   66   67   68   69   70   71   72   73   74   75