Page 69 - Shaping smarter and more sustainable cities - Striving for sustainable development goals
P. 69

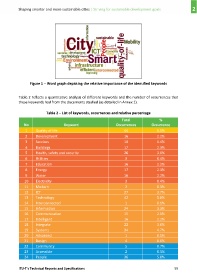
Figure 1 – Word graph depicting the relative importance of the identified keywords


            Table 2 reflects a quantitative analysis of different keywords and the number of occurrences that
            these keywords had from the documents studied (as detailed in Annex 1).


                             Table 2 – List of keywords, occurrences and relative percentage
                                                                           Total                 %
                No                      Keyword                        Occurrences           Occurrence
                1      Quality of life                                      44                  6.1%
                2      Development                                          16                  2.2%

                3      Services                                             10                  1.4%
                4      Buildings                                            17                  2.3%
                5      Health, safety and security                          26                  3.6%
                6      Utilities                                             3                  0.4%
                7      Education                                            16                  2.2%
                8      Energy                                               17                  2.3%
                9      Water                                                16                  2.2%
                10     Electricity                                           3                  0.4%

                11     Modern                                                2                  0.3%
                12     ICT                                                  27                  3.7%
                13     Technology                                           42                  5.8%
                14     Interconnected                                        1                  0.1%
                15     Information                                          24                  3.3%
                16     Communication                                        15                  2.1%
                17     Intelligent                                          16                  2.2%
                18     Integrate                                            22                  3.0%
                19     Systems                                              34                  4.7%
                20     Advanced                                              1                  0.1%
                21     Design                                                4                  0.6%
                22     Community                                             5                  0.7%
                23     Accessible                                            2                  0.3%
                24     People                                               36                  5.0%


            ITU‐T's Technical Reports and Specifications                                                  59
   64   65   66   67   68   69   70   71   72   73   74